Core Features
Understanding the Forecast Results
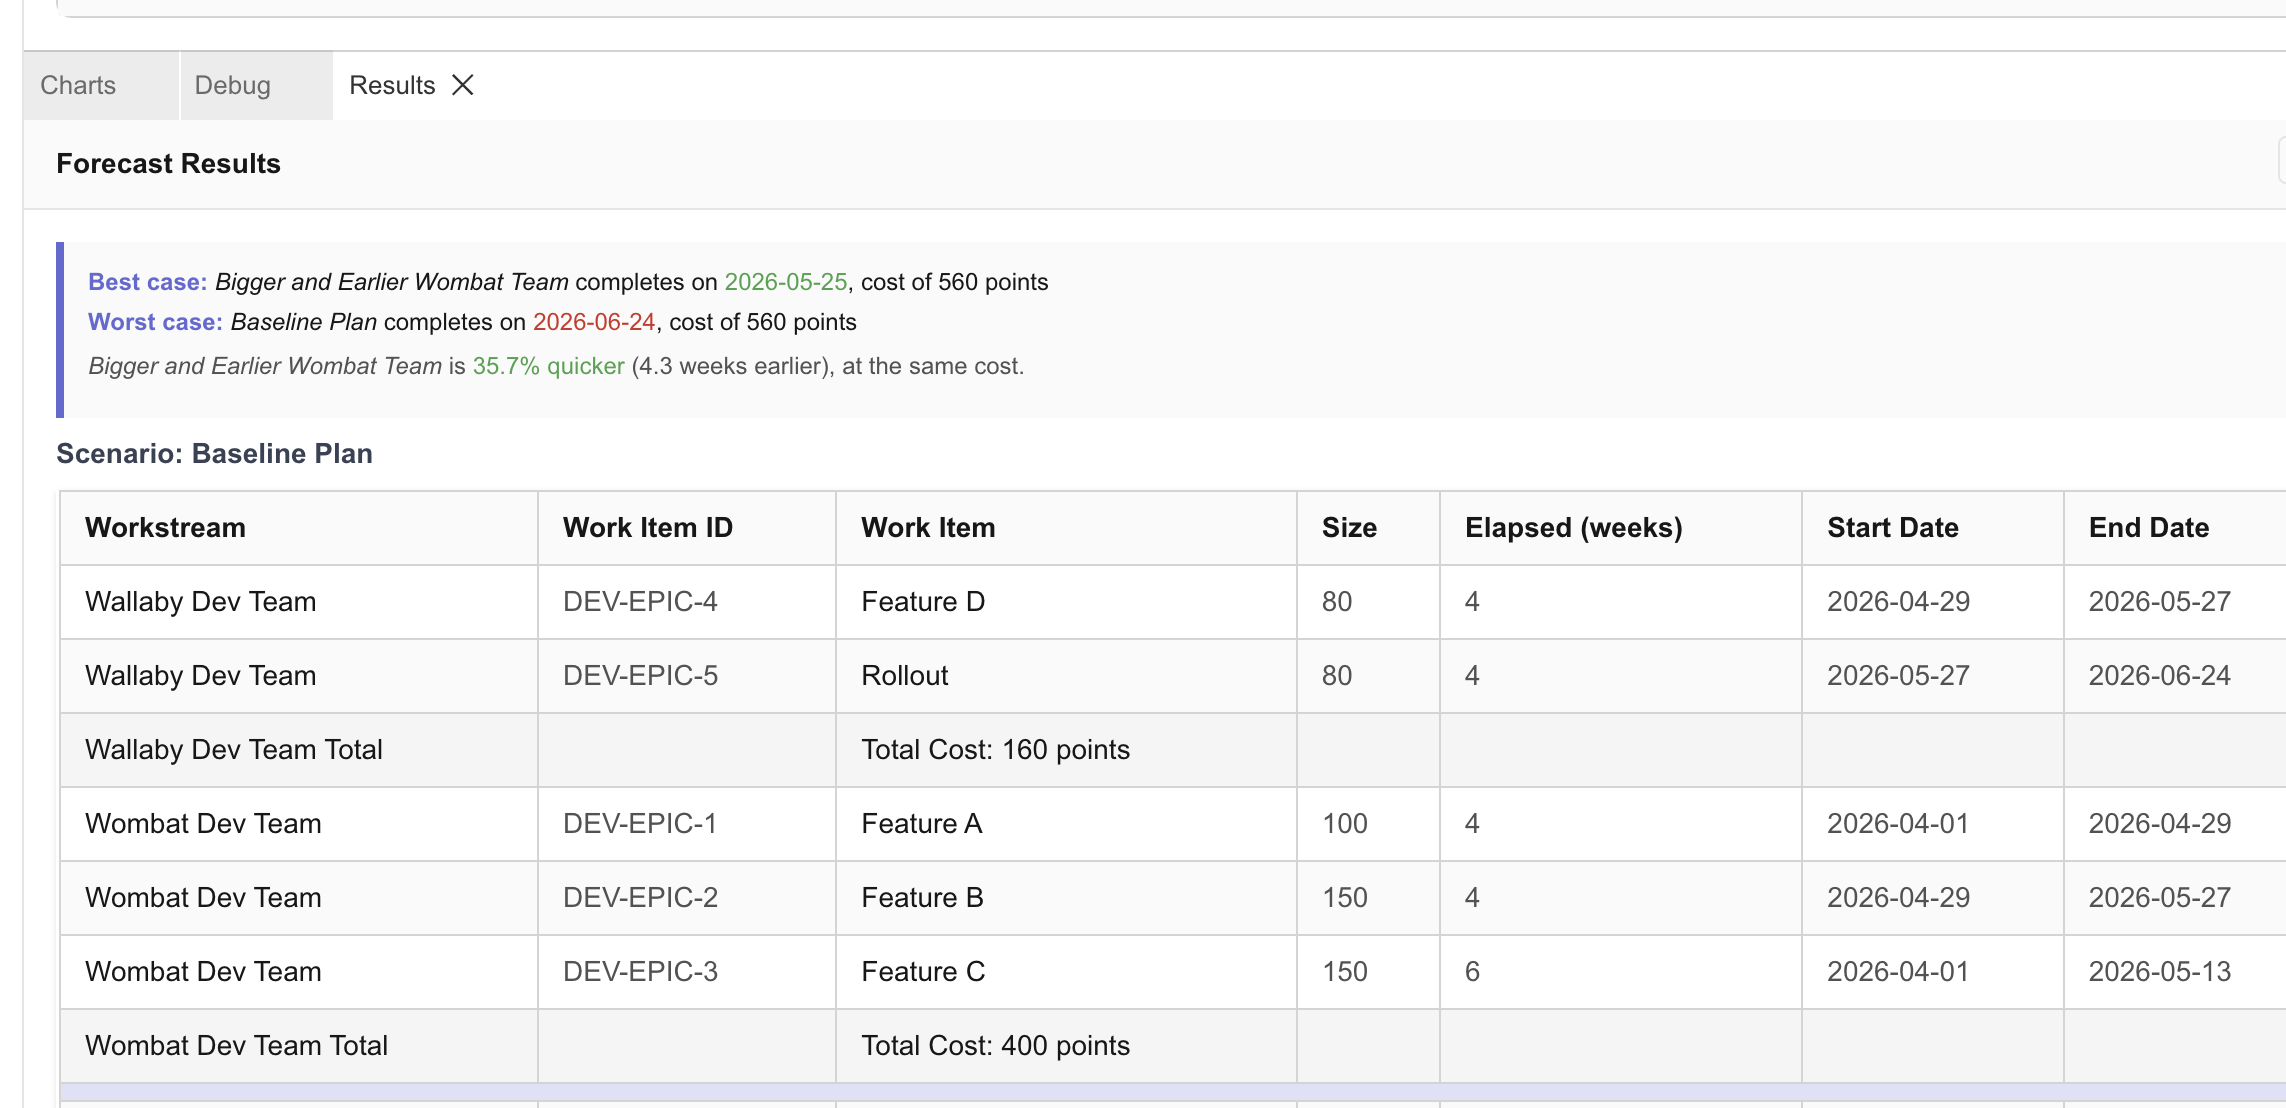
The Results tab provides an executive summary of your project forecast. After generating a forecast, switch to the Results tab to see completion dates, critical path analysis, and scenario comparisons at a glance.
What the Results Tab Shows
The forecast results are calculated from:
- Team capacity (how much work teams can complete per unit of time)
- Work item sizes (how much work needs to be done)
- Dependencies (which work must happen before other work)
- Resource allocation (how capacity is shared across concurrent work)
Farline AI runs the scheduler and presents the output as a structured summary in the Results tab.
Completion Date
The headline result is the projected completion date for each scenario.
What it means:
- The date when the last work item finishes
- Assumes capacity and estimates remain constant
- Changes immediately when you modify the project definition and regenerate
Scenario Comparison
When your project has multiple scenarios, the Results tab shows them side by side so you can compare:
- Completion dates across scenarios
- Which scenario finishes earliest
- The impact of capacity or scope changes
This is the primary way to evaluate "what if" alternatives. See Using the AI Project Builder for how to create scenarios.
Tips for Better Forecasts
- Use realistic capacity based on historical data, not wishful thinking
- Account for overhead — meetings, reviews, and context-switching reduce effective capacity
- Add buffer — multiply estimates by 1.2-1.5x for unknowns
- Review dependencies — too many create bottlenecks, too few might be unrealistic
- Use scenarios — explore optimistic, realistic, and pessimistic cases
Related Articles
- Visualizing Projects - Excalidraw charts, Mermaid, and export options
- Working with Work Items - Sizing and dependencies
- Managing Workstreams and Dependencies - Team and capacity strategies
- Using the AI Project Builder - Create scenarios and ask planning questions
Last updated: 2026-02-11