Understanding the Farline AI Interface
Farline AI features a flexible multi-pane interface that adapts to your workflow. Learn how to customize, move, and optimize your workspace.
Interface Overview
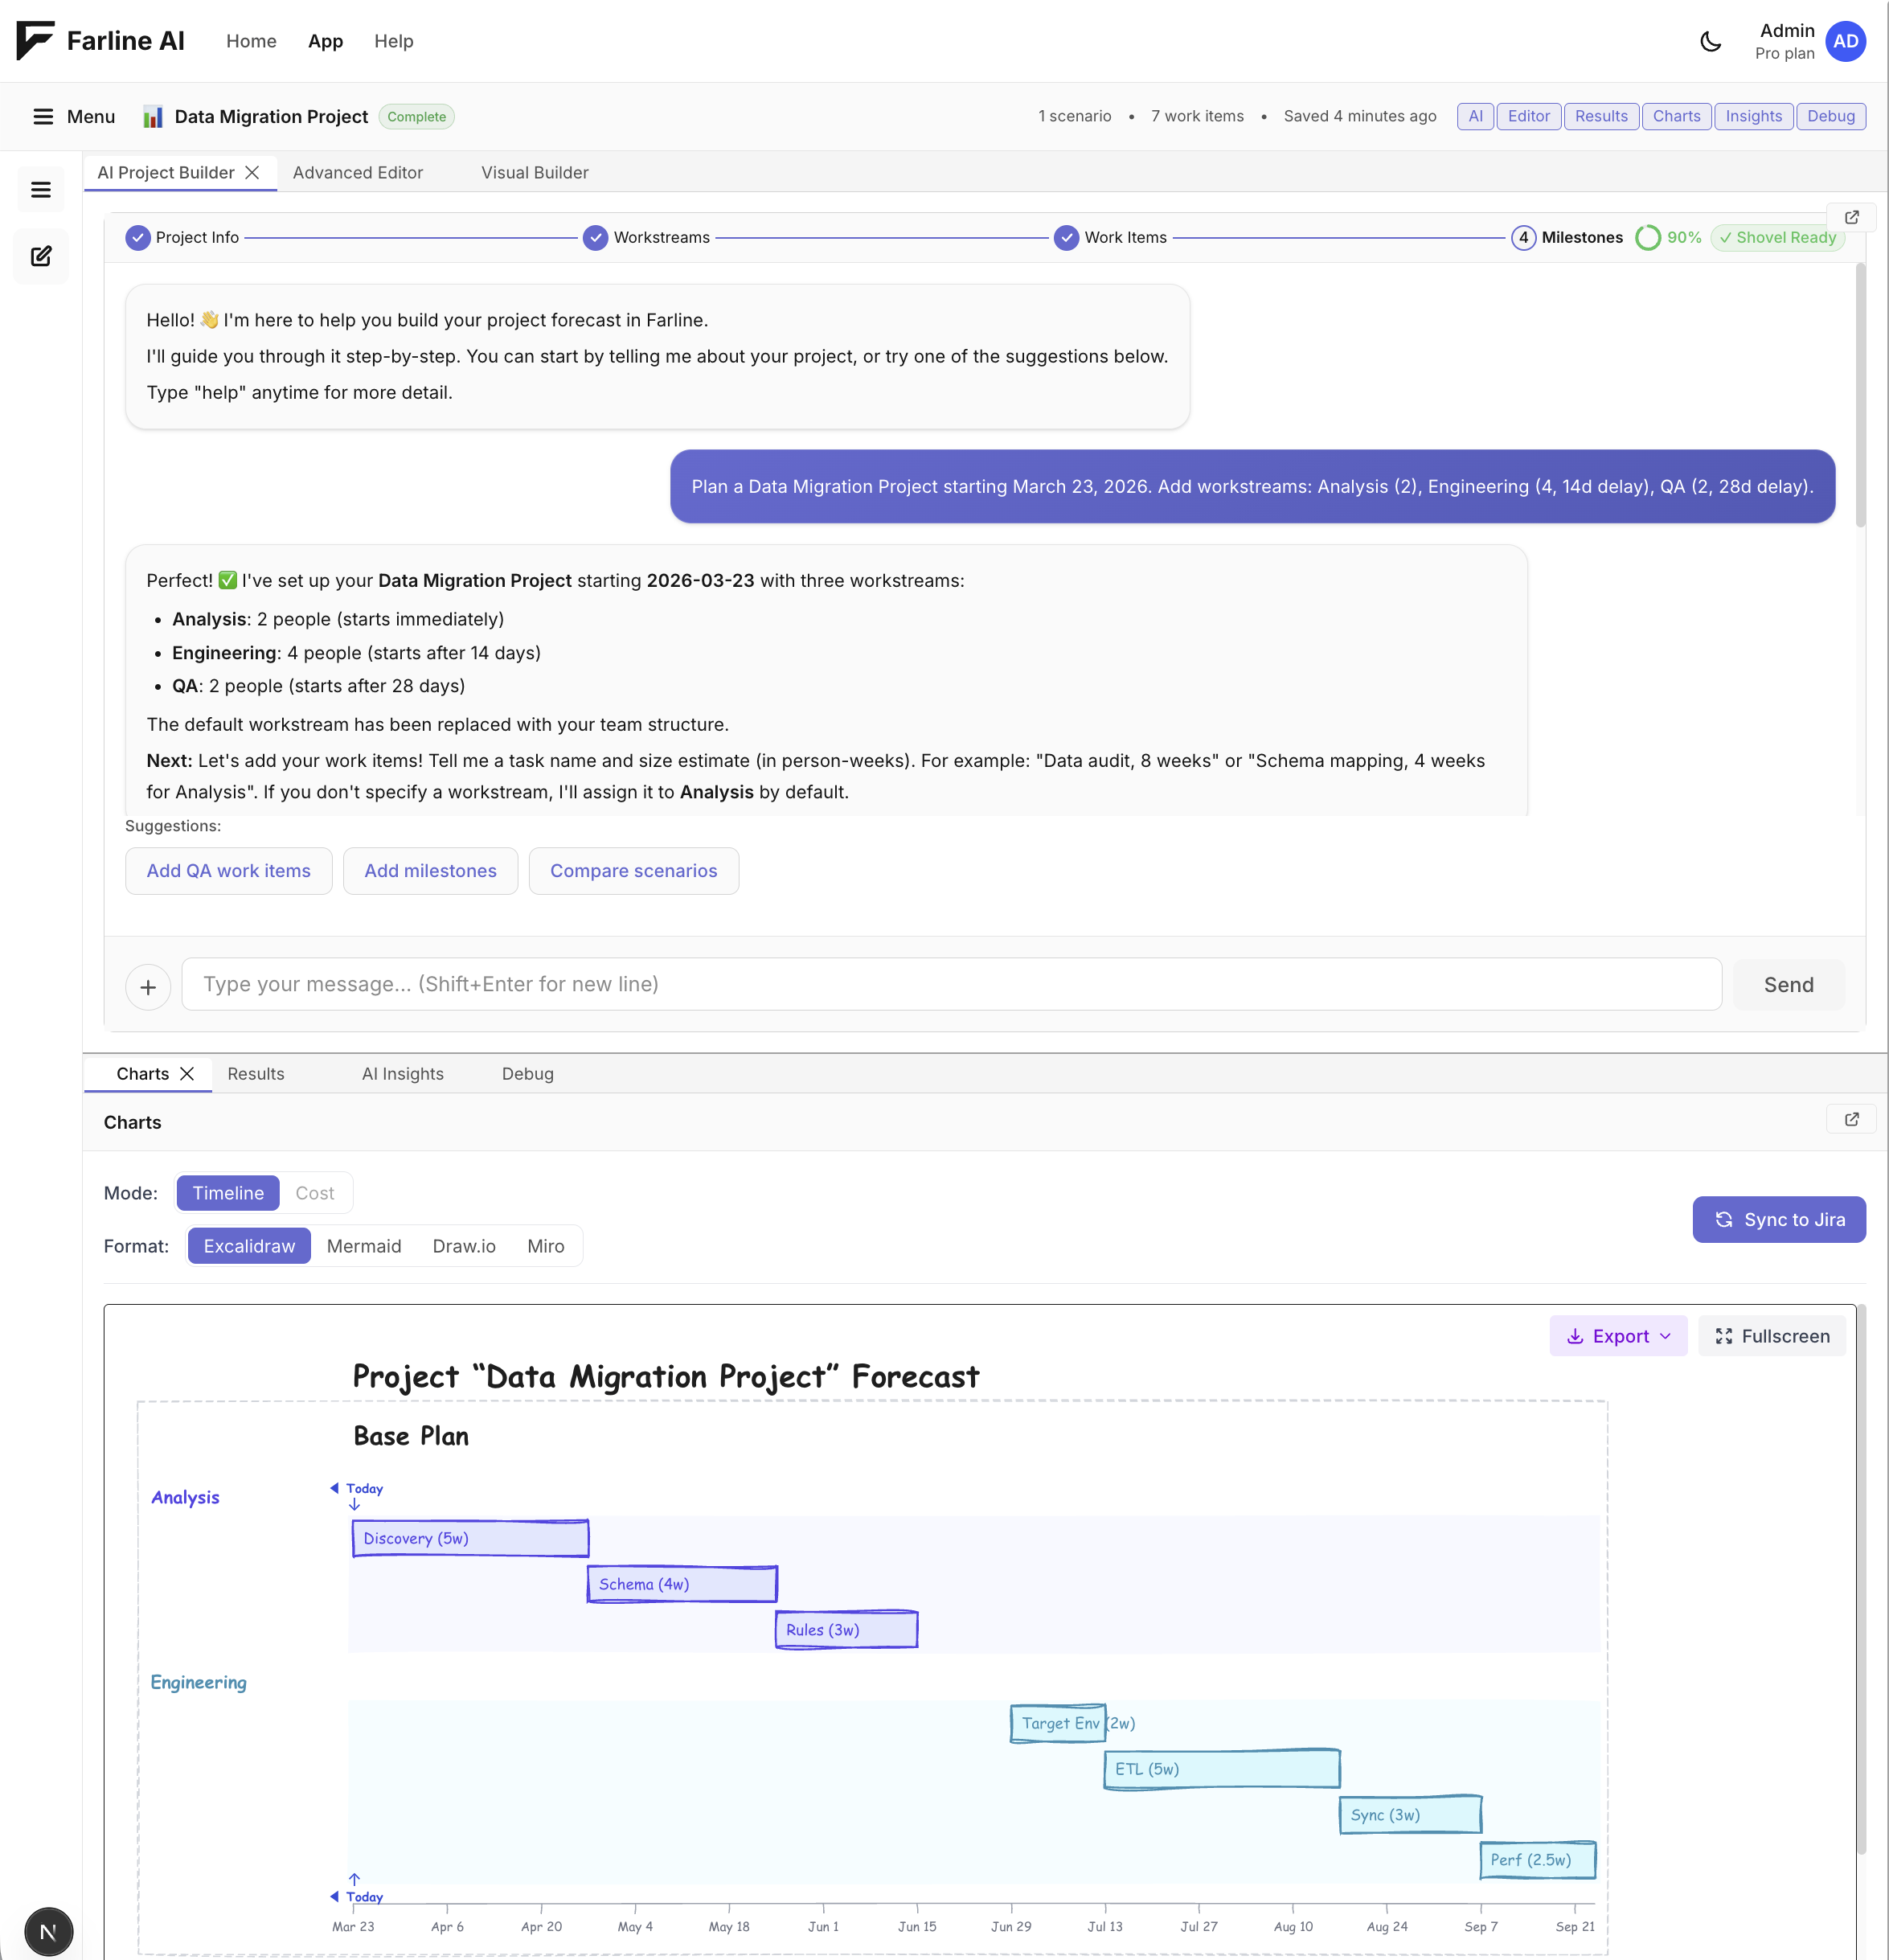
The Farline AI workspace is made up of several panes you can arrange to suit your workflow:
- Project Selector — Switch between projects
- Chat / AI Project Builder — Conversational AI assistant for building and refining your plan
- Visual Builder — Interactive drag-and-drop plan editor; shares a tab group with Chat and Advanced Editor
- Advanced Editor — Direct YAML/text editor for your project definition
- Results — Forecast summary table with completion dates and scenario comparison
- Charts — Visual Gantt timeline and scenario charts
- AI Insights — Plan health, bottlenecks, recommendations, and optimised scenarios
- Debug — Validation errors and technical diagnostics
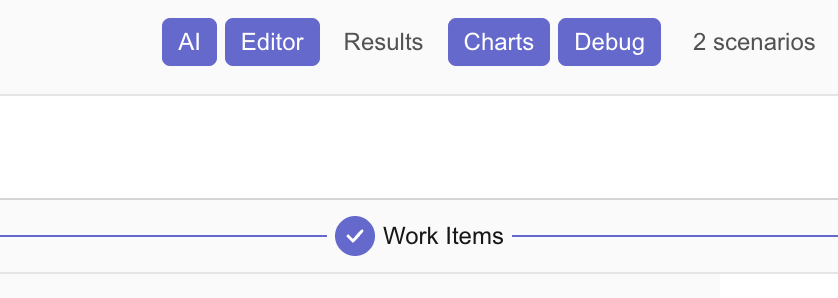
Each pane can be collapsed, resized, and most can pop out to separate windows. Use the toggle buttons in the toolbar (AI, Editor, Results, Charts, Insights, Debug) to quickly show or hide panes — green means visible, grey means hidden.
The Six Panes Explained
1. Project Selector
Purpose: Switch between your projects
Features:
- Dropdown to select different projects
- Create new project button
- Shows current project name
- Quick access to all your saved projects
Collapse/Expand:
- Click the arrow icon to toggle
2. Chat Interface
Purpose: Interact with AI to build and modify projects
Features:
- Natural language conversation
- Project progress indicator with percentage (0–100%) and "Shovel Ready" status
- Project generation and editing
- Scenario creation
- Context-aware suggestions
- Conversation history
Controls:
- Collapse: Click header bar or use keyboard shortcut
- Pop out: Click pop-out icon (opens in separate window)
- Resize: Drag the divider between Chat and other panes
Pro tip: Pop out Chat to a second monitor for more workspace
3. Visual Builder
Purpose: Drag-and-drop plan editing without writing YAML
Features:
- Visual representation of your project's workstreams and work items
- Add, move, and resize work items directly on the canvas
- Set dependencies by connecting items
- Changes sync instantly with the project definition
When to use:
- You prefer a visual, spatial approach to planning
- You want to restructure the plan quickly without editing text
- Presenting your plan to stakeholders in an editable view
How to access: Click the Visual Builder tab in the left tab group, or open it from the Editor menu.
4. Advanced Editor (Project Definition)
Purpose: Direct project definition editing
Features:
- Syntax highlighting
- Real-time validation
- Error detection with red underlines
- Auto-formatting
- Undo/redo support
Controls:
- Collapse: Hide when you're not editing the project definition
- Pop out: Edit the project definition in a separate window
- Resize: Drag dividers to make editor larger/smaller
When to use:
- Making bulk changes to your project
- Fine-tuning work item sizes
- Copying project definitions to share with team
- Advanced users who prefer text over chat
5. Results Table
Purpose: Summary of forecast calculations
Features:
- Project completion date
- Scenario comparison
- Milestone dates
- Workstream utilization
- Critical path information
Controls:
- Collapse: Hide when focusing on charts or the project definition
- Pop out: View results in separate window
- Resize: Make taller to see more details
Best for: Quick overview of project timeline and dates
6. Charts Pane
Purpose: Visual timeline and project forecast charts
Features:
- Mermaid charts (text-based, exportable)
- DayPilot interactive charts
- Toggle between chart types
- Copy to clipboard (Mermaid)
- Visual project timeline
Controls:
- Collapse: Hide when editing the project definition or chatting
- Pop out: View charts on second monitor
- Resize: Make wider for better chart viewing
Chart types:
- Mermaid: For exporting to Confluence, Notion, GitHub
- DayPilot: For interactive exploration and presentations
7. AI Insights
Purpose: AI-powered analysis of your plan's health and optimisation opportunities
Features:
- Plan health score and risk summary
- Bottleneck detection with severity scores
- Quick-fix recommendations (one-click apply)
- Scenario ranking across all your scenarios
- Generate Optimised Scenario — AI proposes a coordinated set of changes to hit a goal (fastest delivery, lowest cost, or balanced)
Controls:
- Toggle with the Insights button in the top-right toolbar
- Collapse to focus on Charts; expand when reviewing plan health
Related: AI Insights · Generating Optimised Scenarios
8. Debug Pane
Purpose: Technical information, errors, and validation
Features:
- Project definition validation errors
- Parsing errors with line numbers
- Tier validation warnings
- Technical diagnostics
- Project structure insights
Controls:
- Collapse: Hide when everything is working fine
- Resize: Make taller to see full error messages
When to check:
- Project definition has red underlines
- Charts aren't rendering
- Project validation fails
- Want to see technical details
Managing Your Workspace
Collapsing and Expanding Panes
Use the toggle buttons in the top-right toolbar to show or hide panes (described above), or click a pane's header bar to collapse it.
Keyboard shortcut:
Cmd+.(Ctrl+. on Windows/Linux): Toggle between AI Project Builder and Advanced Editor tabs
Resizing Panes
Drag dividers:
- Hover over the line between two panes
- Cursor changes to resize icon (↔️ or ↕️)
- Click and drag to adjust size
- Release to set new size
Tips:
- Make Chat wider for longer conversations
- Make Charts wider for complex timelines
- Make Editor taller when editing long project definitions
- Make Results taller to see all scenarios
Sizes are saved:
- Your preferred sizes persist across sessions
- Saved with your account
Popping Out Panes
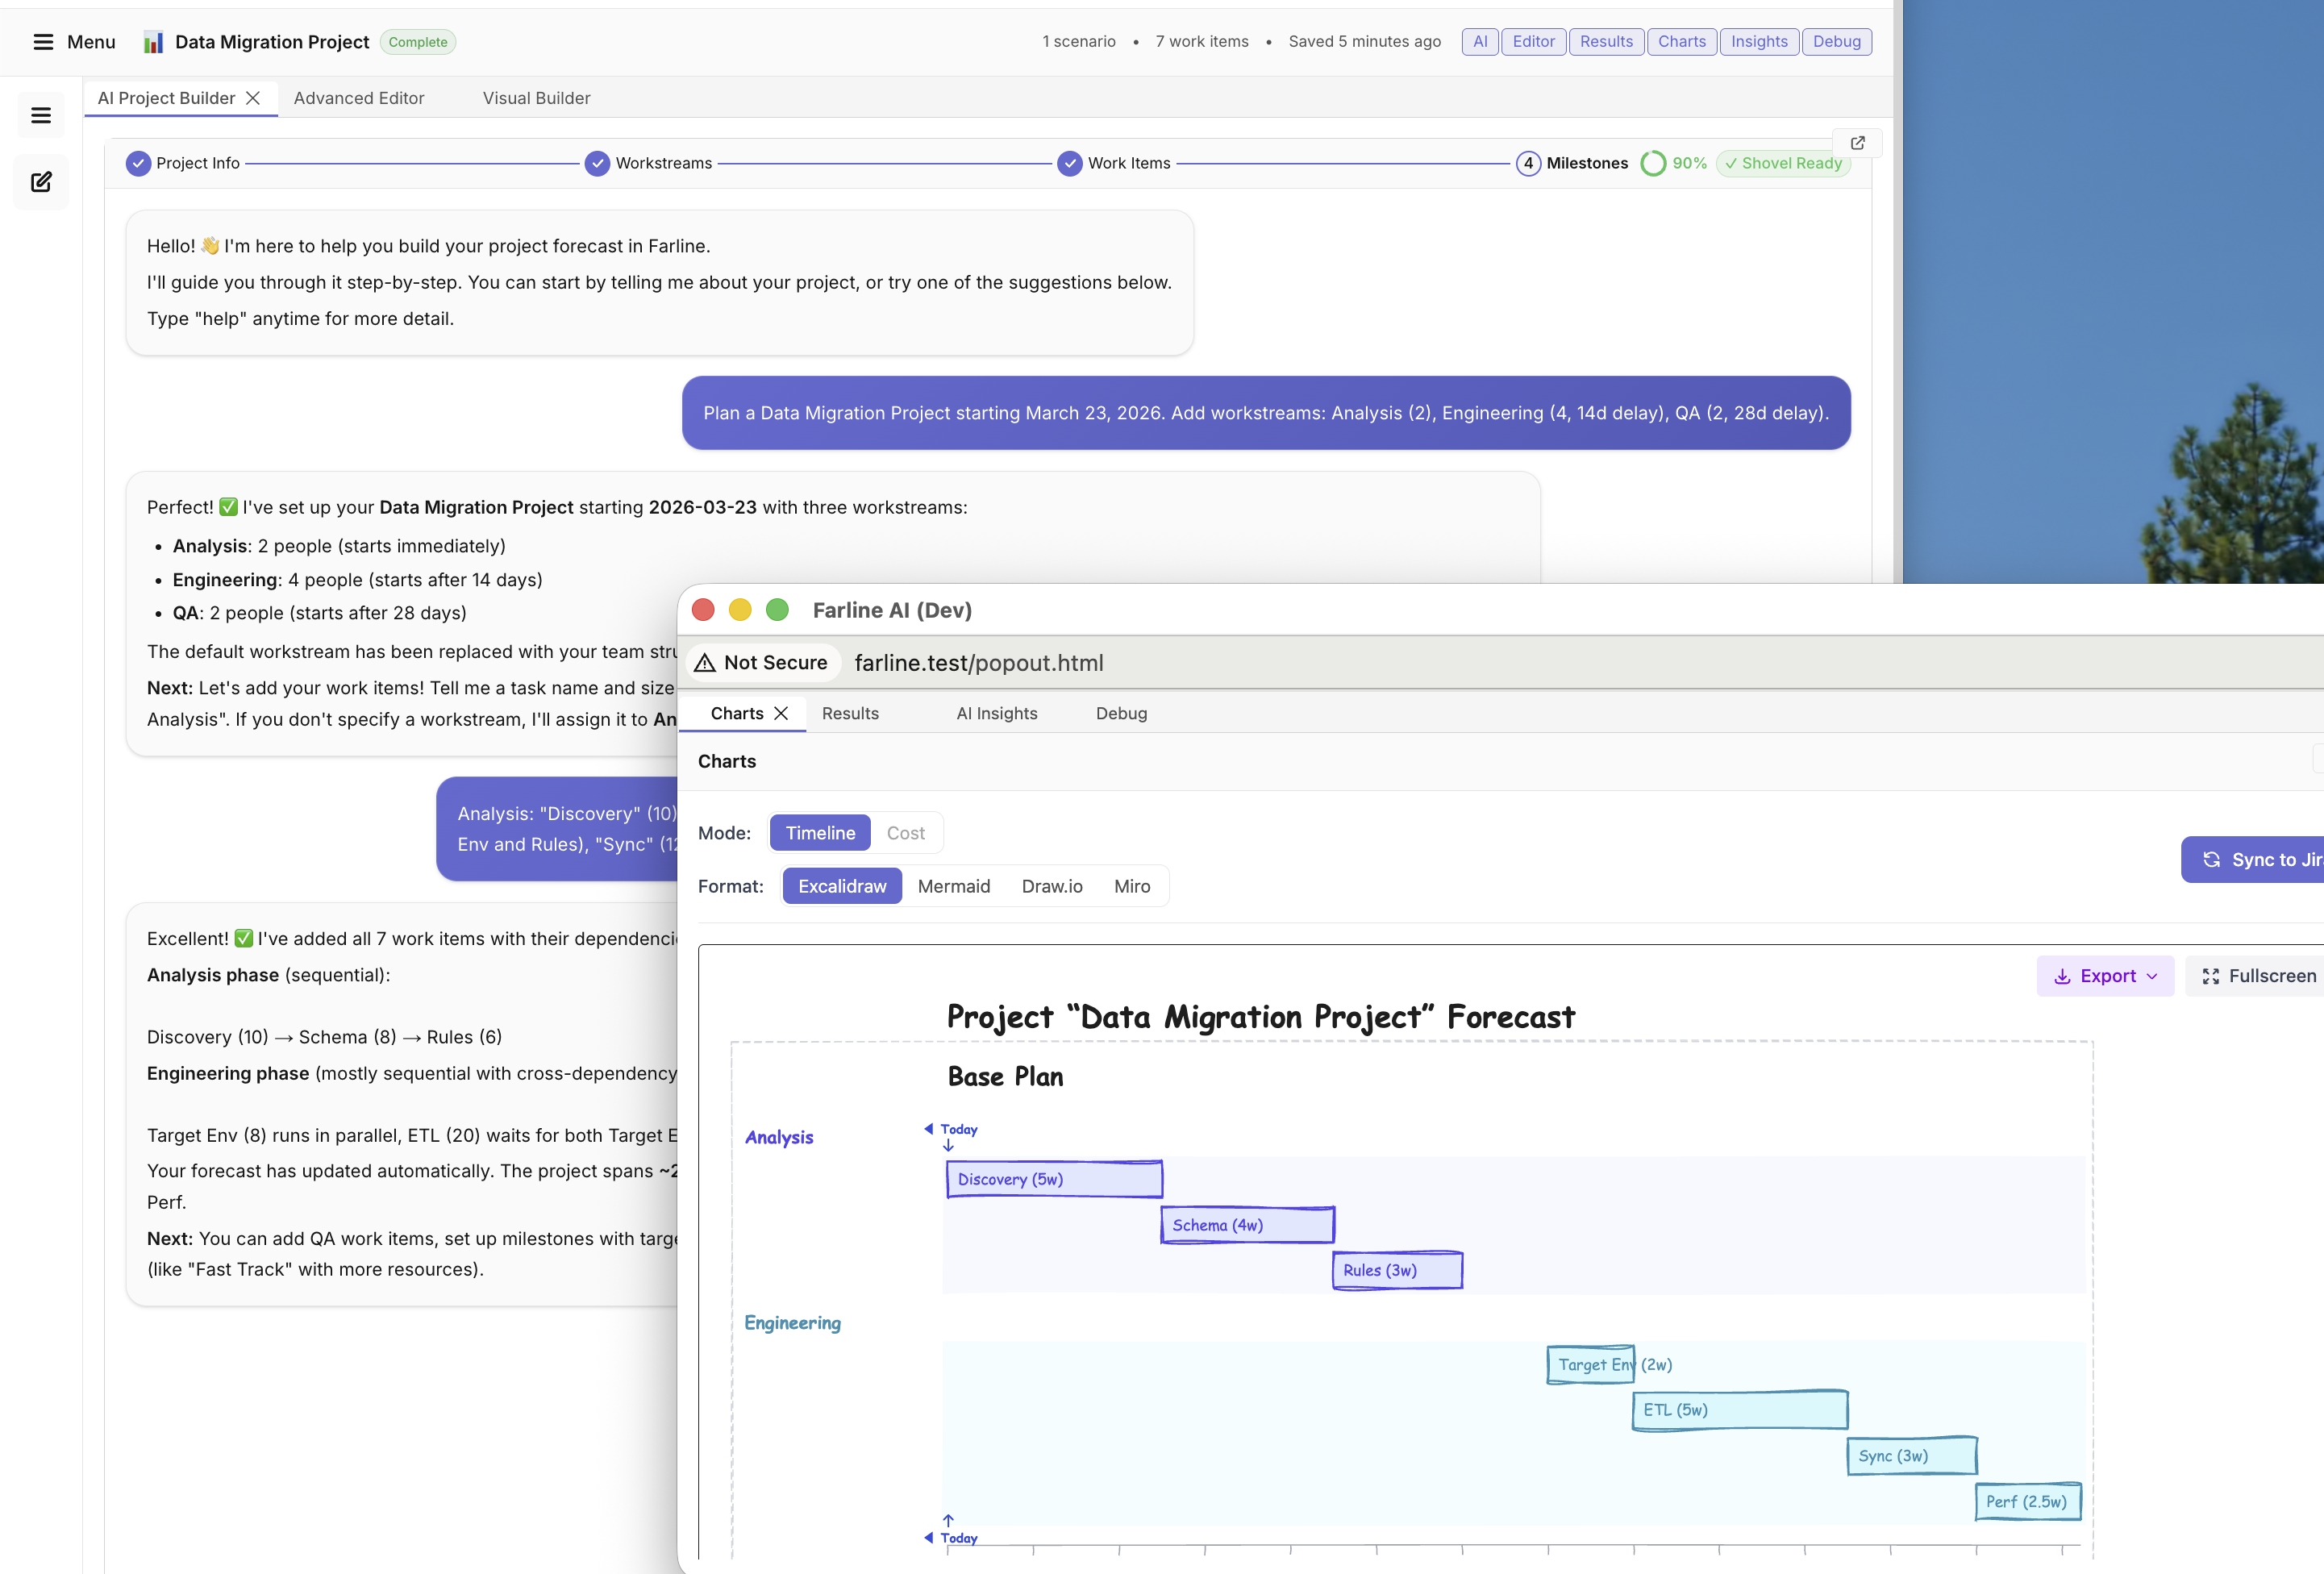
Some panes can open in separate windows for multi-monitor setups.
Which panes support pop-out:
- ✅ Chat
- ✅ Advanced Editor
- ✅ Results
- ✅ Charts
- ❌ Project Selector (always in main window)
- ❌ Debug (always in main window)
How to pop out:
- Look for the pop-out icon in the pane header (icon with arrow pointing out)
- Click to open in new window
- Position on second monitor
- Click "pop in" icon to return to main window
Popout benefits:
- Use Chat on one screen, Charts on another
- Edit project definition while viewing Results
- More screen real estate
- Multiple panes visible simultaneously
Popout limitations:
- Requires multiple windows/monitors
- Position not saved on mobile browsers
- Desktop browser recommended
Layout Presets
Save and load custom workspace layouts.
Saving a Preset
- Arrange panes how you like them
- Collapse/expand as desired
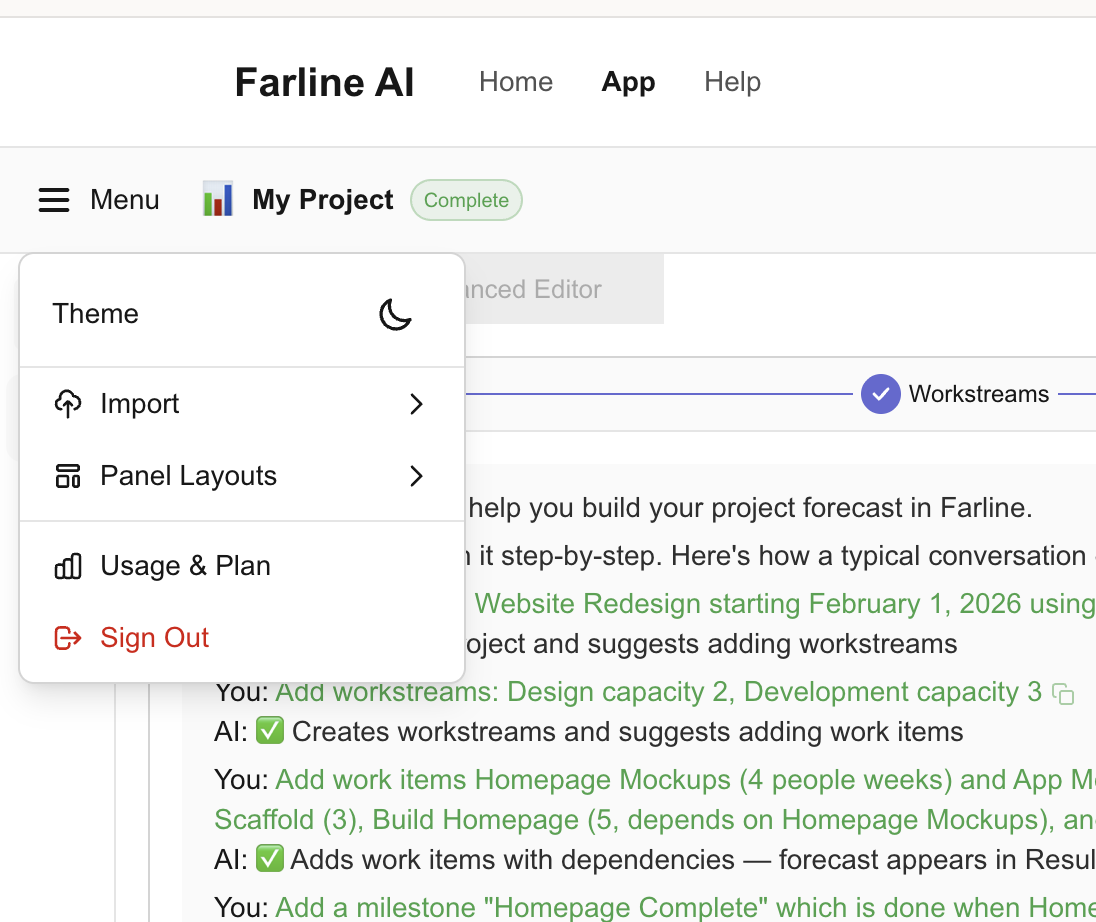
- Click Menu → Layout → Save Preset
- Name your preset (e.g., "Editing Mode", "Presenting")
- Click Save
What gets saved:
- Which panes are collapsed
- Pane sizes
- Popout states
- Focus state
Loading a Preset
- Click Menu → Layout → Load Preset
- Choose from saved presets
- Workspace instantly rearranges
Deleting a Preset
- Click Menu → Layout → Manage Presets
- Click delete icon next to preset
- Confirm deletion
Built-in Preset Ideas
Create presets for different workflows:
"Editing Focus":
- Chat: Collapsed
- Editor: Expanded (full width)
- Results: Collapsed
- Charts: Collapsed
- Debug: Collapsed
"Chat Mode":
- Chat: Expanded (full width)
- Editor: Collapsed
- Results: Visible (small)
- Charts: Visible (small)
- Debug: Collapsed
"Presentation":
- Chat: Collapsed
- Editor: Collapsed
- Results: Visible (medium)
- Charts: Expanded (full width)
- Debug: Collapsed
"Debugging":
- Chat: Collapsed
- Editor: Visible (medium)
- Results: Collapsed
- Charts: Collapsed
- Debug: Expanded (tall)
Switching Between Panes
Use Cmd+. (Ctrl+. on Windows/Linux) to quickly toggle between the AI Project Builder and Advanced Editor tabs. This is the fastest way to switch between conversational AI interaction and direct project definition editing.
Tips for Different Workflows
For Beginners
Recommended layout:
- Chat: Expanded (50% width)
- Editor: Collapsed (let AI generate project definition)
- Results: Visible (small)
- Charts: Visible (30% width)
- Debug: Collapsed (only open if errors)
Why: Focus on Chat for natural language interaction, see results visually
For Advanced Users
Recommended layout:
- Chat: Small or collapsed (occasional use)
- Editor: Expanded (50% width for direct editing)
- Results: Visible (medium)
- Charts: Visible (30% width)
- Debug: Small (catch errors early)
Why: Direct project definition editing is faster once you know the syntax
For Presentations
Recommended layout:
- Chat: Collapsed
- Editor: Collapsed
- Results: Visible (30% width)
- Charts: Maximized (70% width)
- Debug: Collapsed
Why: Clean view focusing on timeline and forecast data
For Multi-Monitor Setups
Recommended layout:
- Monitor 1: Editor + Results + Debug
- Monitor 2 (popped out): Charts
- Monitor 3 (popped out): Chat (optional)
Why: Maximum screen real estate, all info visible
Keyboard Shortcuts Reference
| Shortcut | Action |
|---|---|
Cmd+. (Ctrl+. on Windows/Linux) | Toggle between AI Project Builder and Advanced Editor |
Best Practices
Start simple: Use default layout initially, customize as you learn
Save presets: Create presets for your common workflows
Use keyboard shortcuts: Cmd+. to toggle between AI Project Builder and Editor
Hide what you don't need: Collapsed panes = less clutter
Pop out on big screens: Multi-monitor setups benefit from popouts
Reset when confused: Menu → Reset Layout brings you back to defaults
Experiment: Try different layouts to find what works for you
Related Articles
- Using the AI Project Builder — Master the Chat pane
- Using the Advanced Editor — Learn the Editor pane
- Visualizing Projects — Get the most from the Charts pane
- AI Insights — Plan health, bottlenecks, and recommendations
- Generating Optimised Scenarios — AI-driven scenario optimisation
Last updated: 2026-03-17