AI Insights
The AI Insights tab gives you an instant read on the health of your plan — without having to interpret raw numbers. It analyses your forecast automatically and surfaces bottlenecks, critical path items, and actionable recommendations including one-click quick fixes and AI-powered optimisation.
Opening AI Insights
Click the Insights button in the top toolbar to show or hide the panel. It appears as a tab alongside Charts, Results, and Debug in the lower panel row.
Scenario Ranking
When your project has multiple scenarios, a Rank by toggle appears at the top of the panel letting you sort them by:
| Option | Sorts by |
|---|---|
| Fastest | Shortest total duration |
| Balanced | Best trade-off between time and cost |
| Cheapest | Lowest total cost |
Each scenario is listed with its duration and cost at a glance, so you can immediately see which option wins on each dimension.
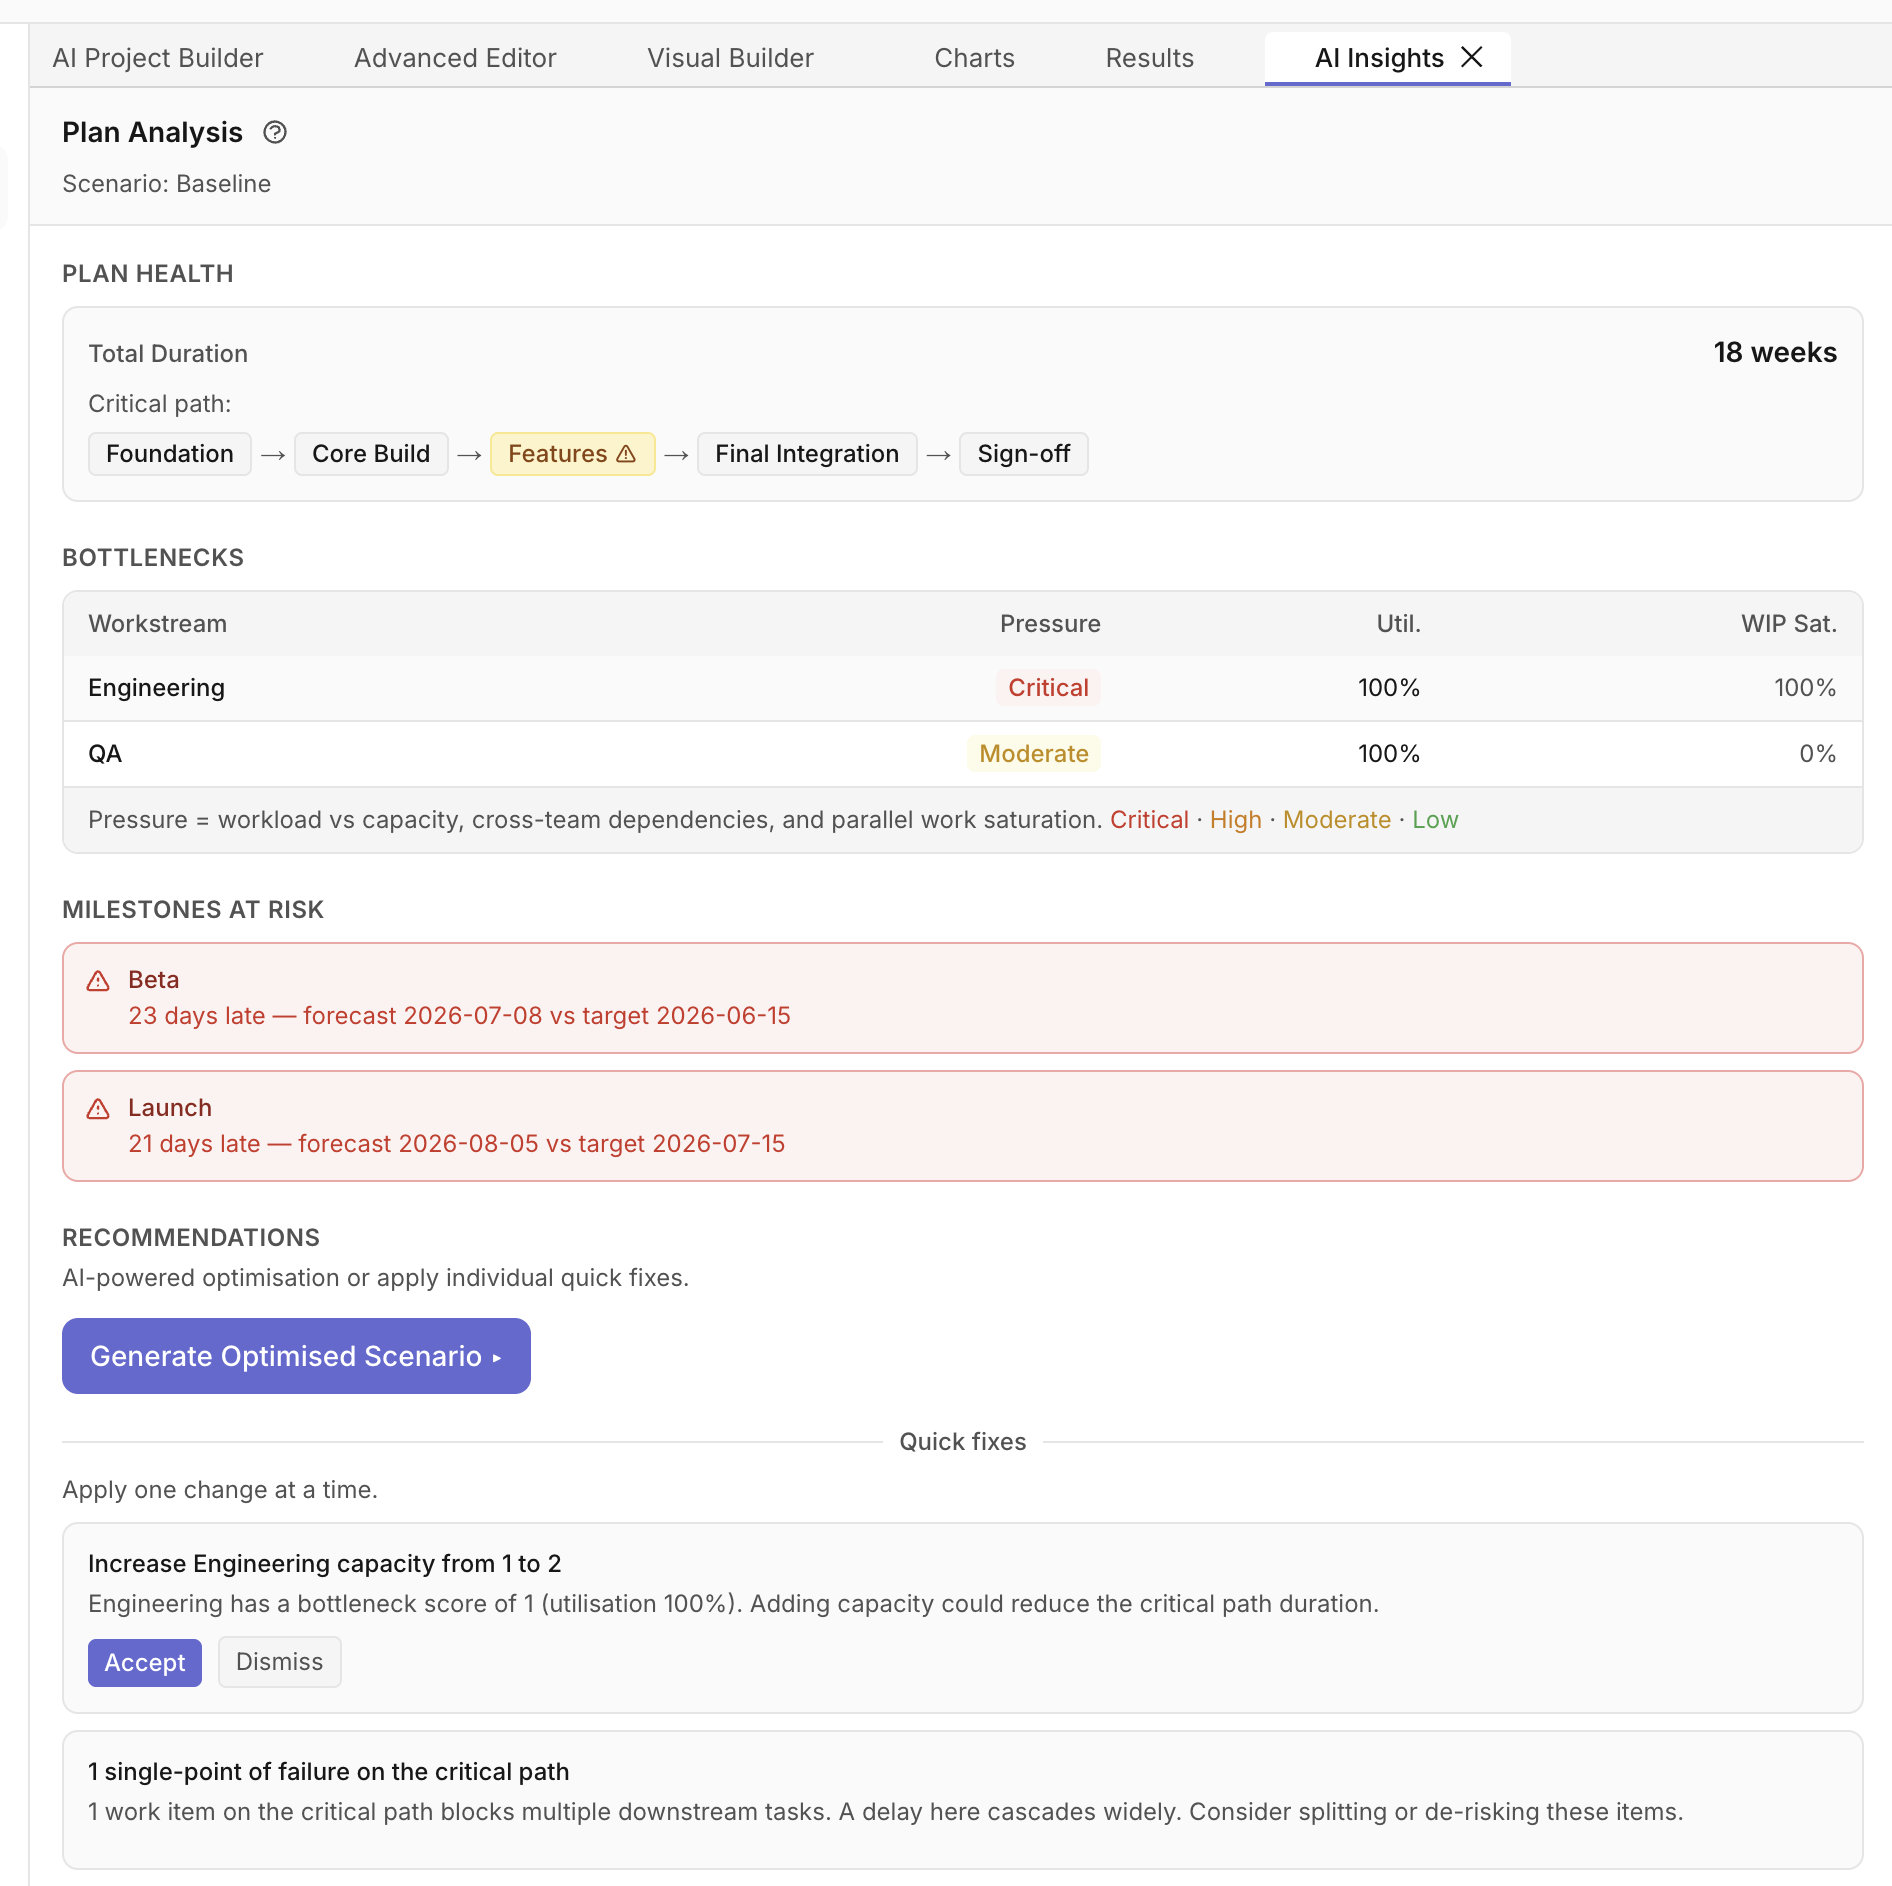
Plan Health
Shows the total project duration and the critical path — the sequence of work items that directly determines your end date. Any delay to a critical path item delays the whole project.
Items marked with ⚠ are single points of failure: they sit on the critical path and have multiple tasks depending on them, so a slip cascades widely.
Bottlenecks
A table of your workstreams ranked by pressure — how hard each team is being pushed relative to their capacity, cross-team dependencies, and how often they're fully loaded with parallel work.
| Label | Meaning |
|---|---|
| Critical | Severely overloaded — likely causing schedule delays |
| High | Significant pressure — worth watching closely |
| Moderate | Some congestion but manageable |
| Low | Healthy capacity headroom |
Pressure is calculated from three factors:
- Utilisation — total work assigned vs available capacity
- Cross-team dependencies — how many other workstreams are waiting on this one
- WIP saturation — how often the team is fully occupied with parallel work
Milestones at Risk
Lists your milestones with their forecast date vs target date. At-risk milestones are shown in red with the number of days late. On-track milestones are shown in green with days of slack.
Recommendations
The Recommendations section offers two ways to improve your plan: AI-powered optimisation or individual quick fixes.
Generate Optimised Scenario
The Generate Optimised Scenario button asks the AI to propose a coordinated set of changes tailored to a specific goal — fastest delivery, lowest cost, or a balanced trade-off. You review the proposals, select which ones to apply, and a new scenario is created in one step.
See Generating Optimised Scenarios for the full walkthrough including cost optimisation.
Note: Generate Optimised Scenario is a Pro+ feature.
Quick Fixes
Below the Generate button, Quick fixes lists individual one-at-a-time suggestions based on the bottleneck analysis:
- Increase capacity — for workstreams with Critical or High pressure
- Increase WIP limit — allow more parallel work (only suggested when capacity > 1)
- Single points of failure — informational flag when critical-path items block multiple successors
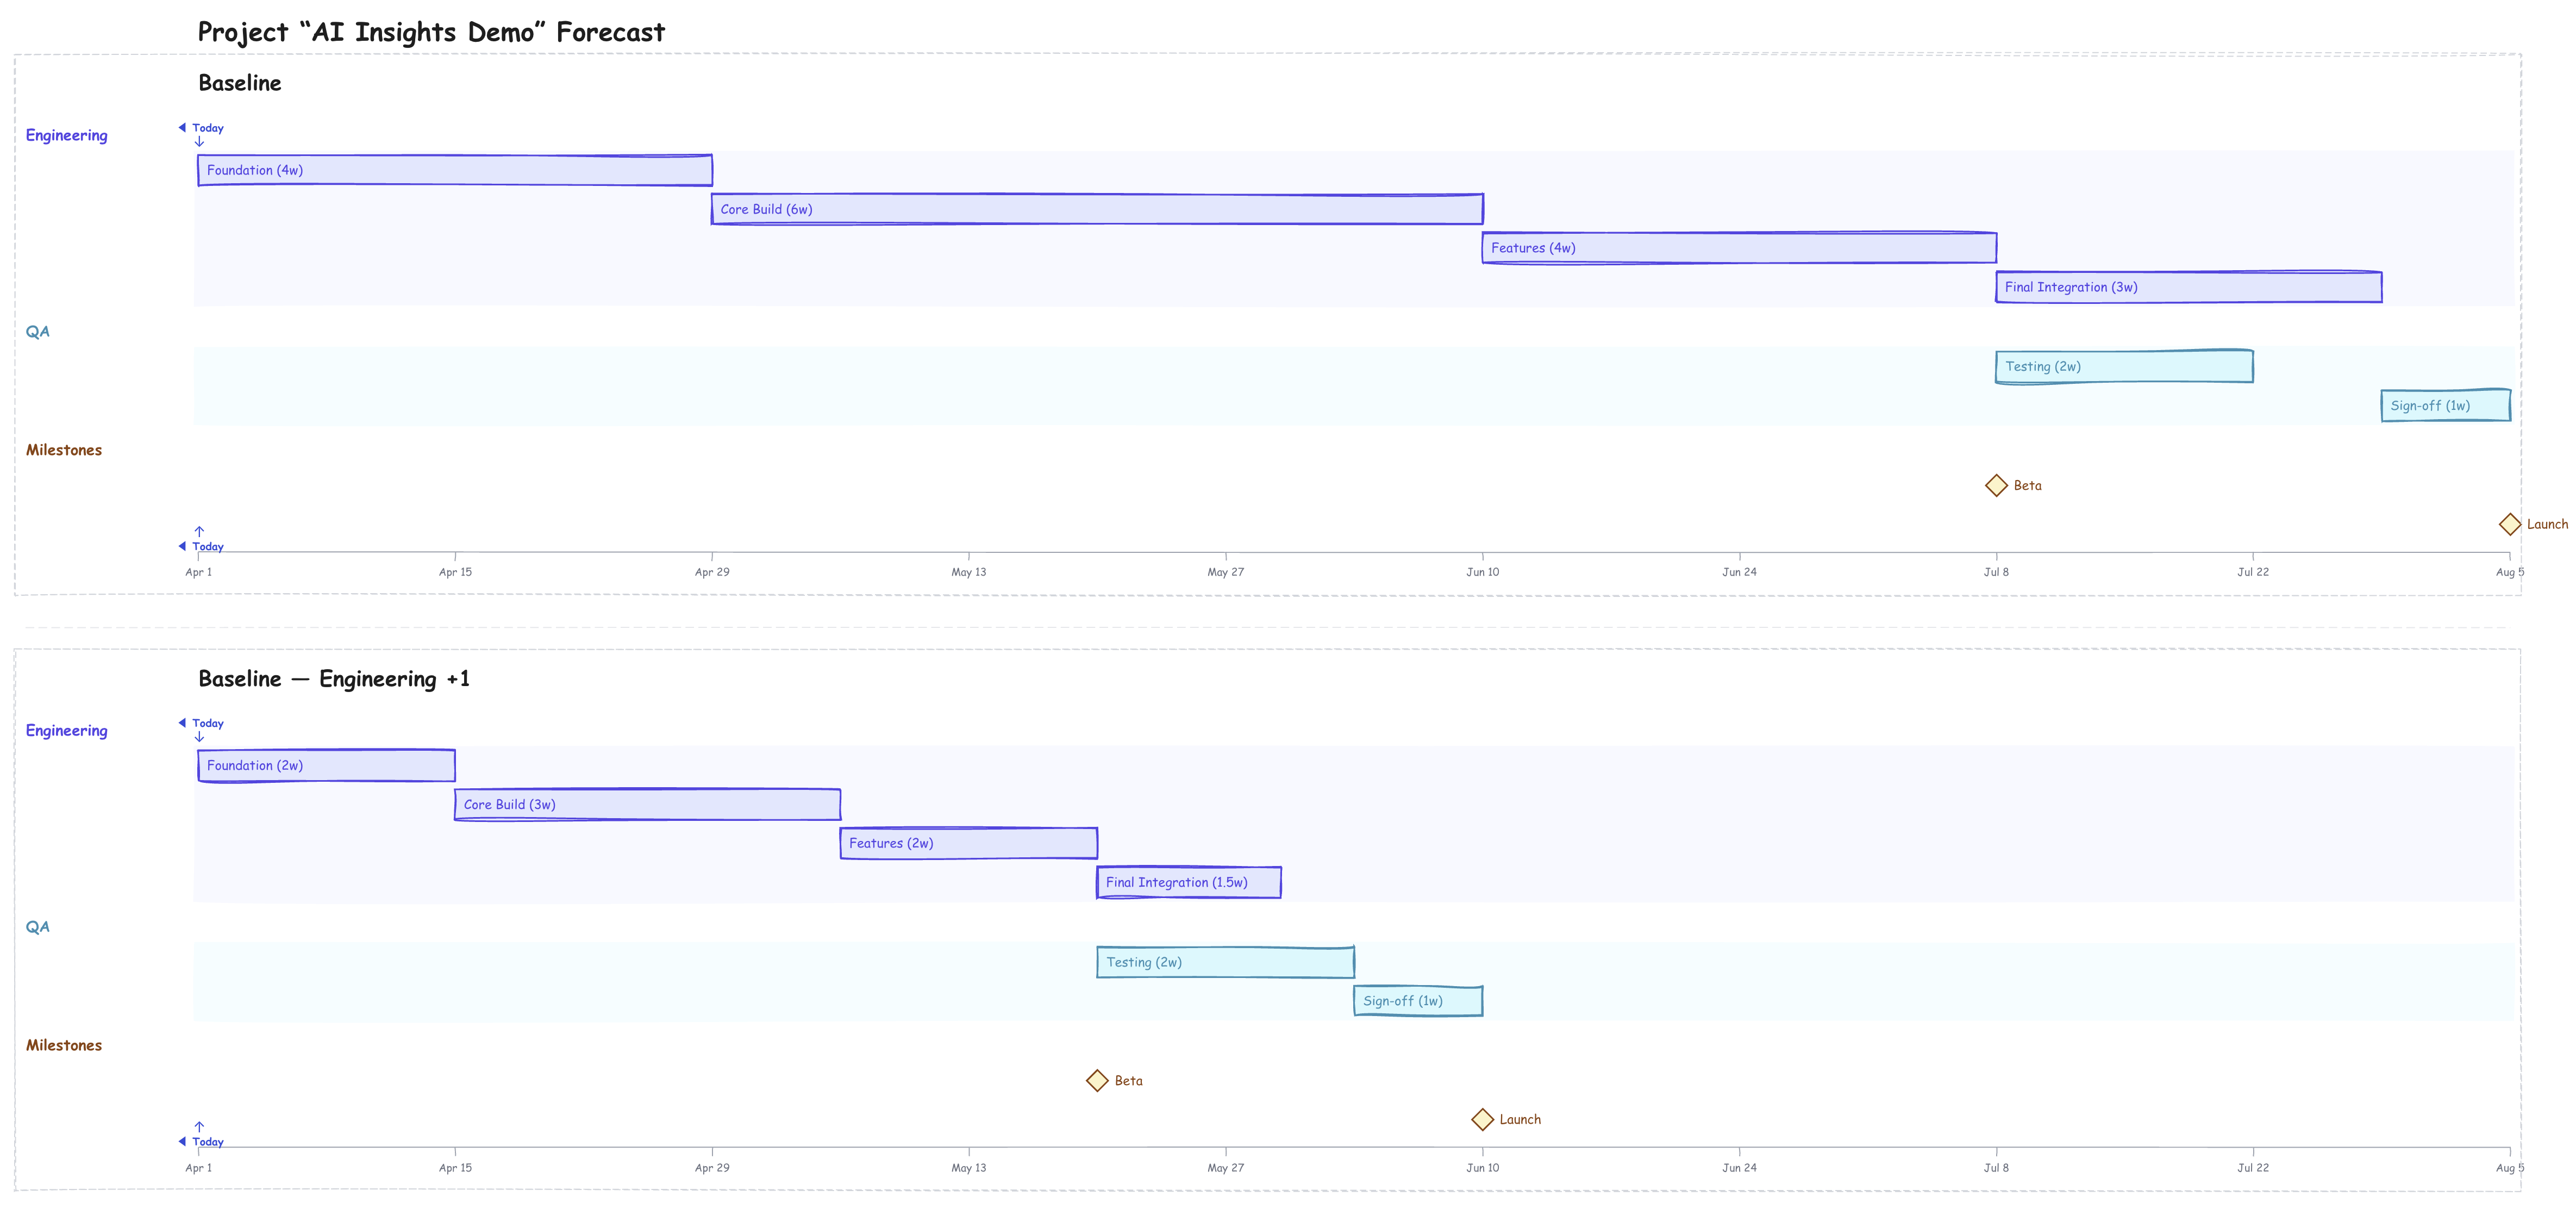
Click Accept to apply a suggestion. Farline creates a new scenario with the change applied — for example, accepting "Increase Backend capacity from 2 to 3" creates a new scenario with that change.
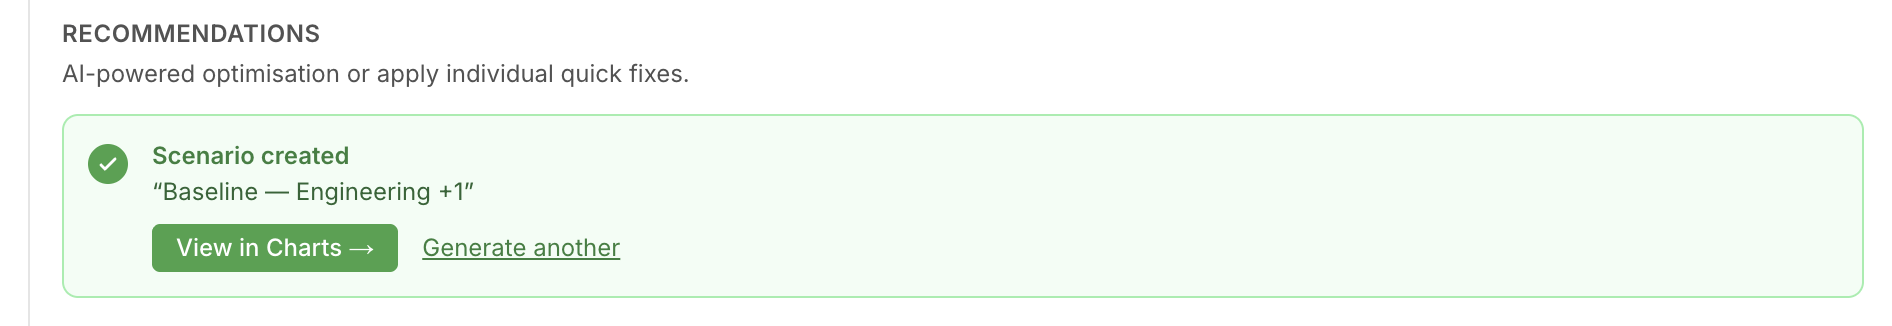
The new scenario appears in the Charts tab alongside your original so you can visually compare the timelines.
Click Dismiss to hide a suggestion for the current session.
Note: Accept is a Pro feature. Free plan users can view suggestions but cannot apply them directly.
Related Articles
- Understanding the Forecast Results - Reading the Results tab
- Budgeting and Cost Analysis - Configure costs for Cheapest ranking
- Managing Workstreams and Dependencies - Capacity and team structure
Last updated: 2026-03-16