Budgeting and Cost Analysis
Farline includes a full cost engine that tracks monetary spend across your project. By assigning a cost per unit to your workstreams and setting a budget, you can see exactly how much each scenario costs, which work items fall inside or outside the budget, and how different staffing choices affect total spend.
How Costs Work
Costs flow from three inputs:
- Unit cost — the monetary value of one capacity unit per week for a workstream (e.g.
unit_cost: 1500means $1,500 per person per week) - Default unit cost — a project-level fallback applied to any workstream that doesn't define its own
unit_cost - Budget — the total money available, set at the project level or overridden per scenario
Farline calculates the cost of each work item by multiplying the workstream's weekly cost by the time the item occupies. These costs accumulate across all work items to produce a total project cost for each scenario.
YAML Reference
Project-level fields
project_name: My Project
unit: people weeks
default_unit_cost: 1500    # fallback cost per capacity unit per week
currency: USD              # ISO 4217 code; defaults to USD
budget: 200000 # total budget for the project| Field | Description |
|---|---|
default_unit_cost | Cost per capacity unit per week, applied to workstreams without their own unit_cost |
currency | ISO 4217 currency code (e.g. USD, GBP, EUR). Displayed in charts and results. |
budget | Project-level budget. Used unless a scenario defines its own budget. |
Workstream-level field
workstreams:
  - name: Engineering
    capacity: 4
    unit_cost: 2000    # overrides default_unit_cost for this workstream
  - name: Design
    capacity: 2
# no unit_cost — uses default_unit_cost from the project| Field | Description |
|---|---|
unit_cost | Cost per capacity unit per week for this workstream. Overrides default_unit_cost. |
Scenario-level budget override
scenarios:
  - scenario: Baseline
    start_date: "2026-04-01"
    budget: 150000    # overrides the project-level budget for this scenario only
    workstreams: ...
Worked Example
Here's a small project that demonstrates cost tracking:
project_name: Website Redesign
unit: people weeks
default_unit_cost: 1500
currency: USD
budget: 200000

scenarios:
  - scenario: Baseline
    start_date: "2026-04-01"
    workstreams:
      - name: Design
        capacity: 2
        unit_cost: 1200
      - name: Engineering
        capacity: 4
        # uses default_unit_cost: 1500
    work_items:
      - id: wi-1
        name: Visual Design
        workstream: Design
        size: 6
      - id: wi-2
        name: Build Components
        workstream: Engineering
        size: 12
        depends_on: [wi-1]
    milestones: []
How costs are calculated:
- Design team: 2 capacity × $1,200/unit/week × (weeks active) = weekly spend
- Engineering team: 4 capacity × $1,500/unit/week × (weeks active) = weekly spend
- Total project cost = sum of all workstream spend over the full schedule
The Results tab shows the total monetary cost alongside elapsed time for each scenario, so you can compare both dimensions when evaluating trade-offs.
Budget, Cut Lines, and Funded vs. Unfunded Items
When a budget is set, Farline calculates a cut line — the week at which the cumulative spend exhausts the budget. Work items are then classified as:
| Status | Meaning |
|---|---|
| Funded | Completes before the budget runs out |
| Partially funded | Started but not finished when the budget is exhausted |
| Unfunded | Hasn't started when the budget runs out |
The cut line appears as a vertical red line on the Gantt chart. Unfunded items are shown in gray; partially funded items show a split bar (colored portion = funded work, gray portion = unfunded).
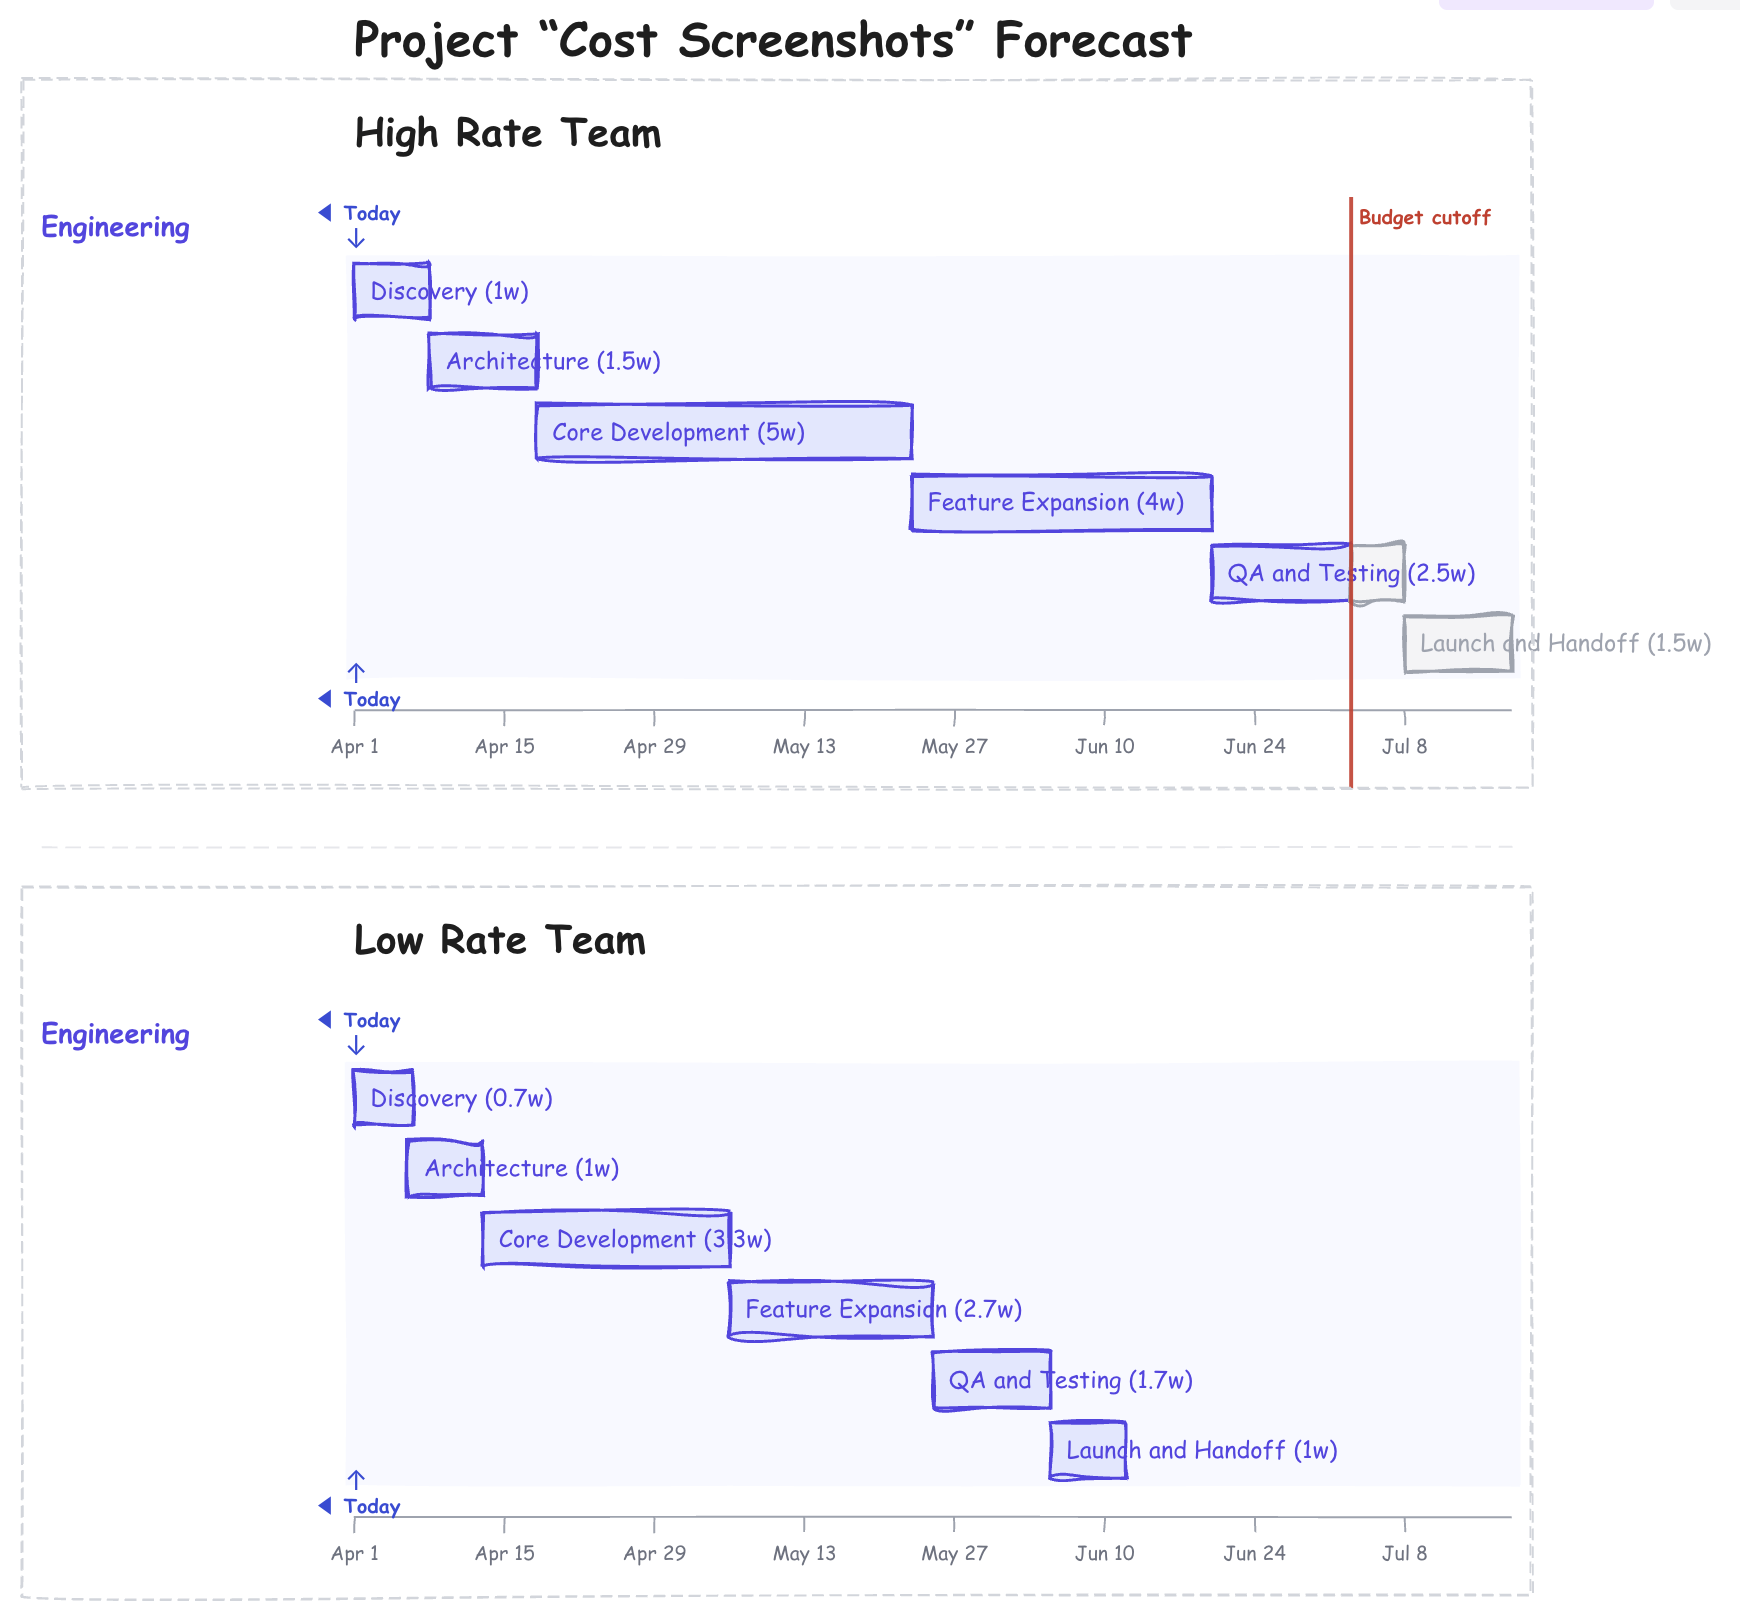
The Results tab reports funded and unfunded item counts for each scenario, helping you answer questions like: "With our current budget, how much scope actually gets delivered?"
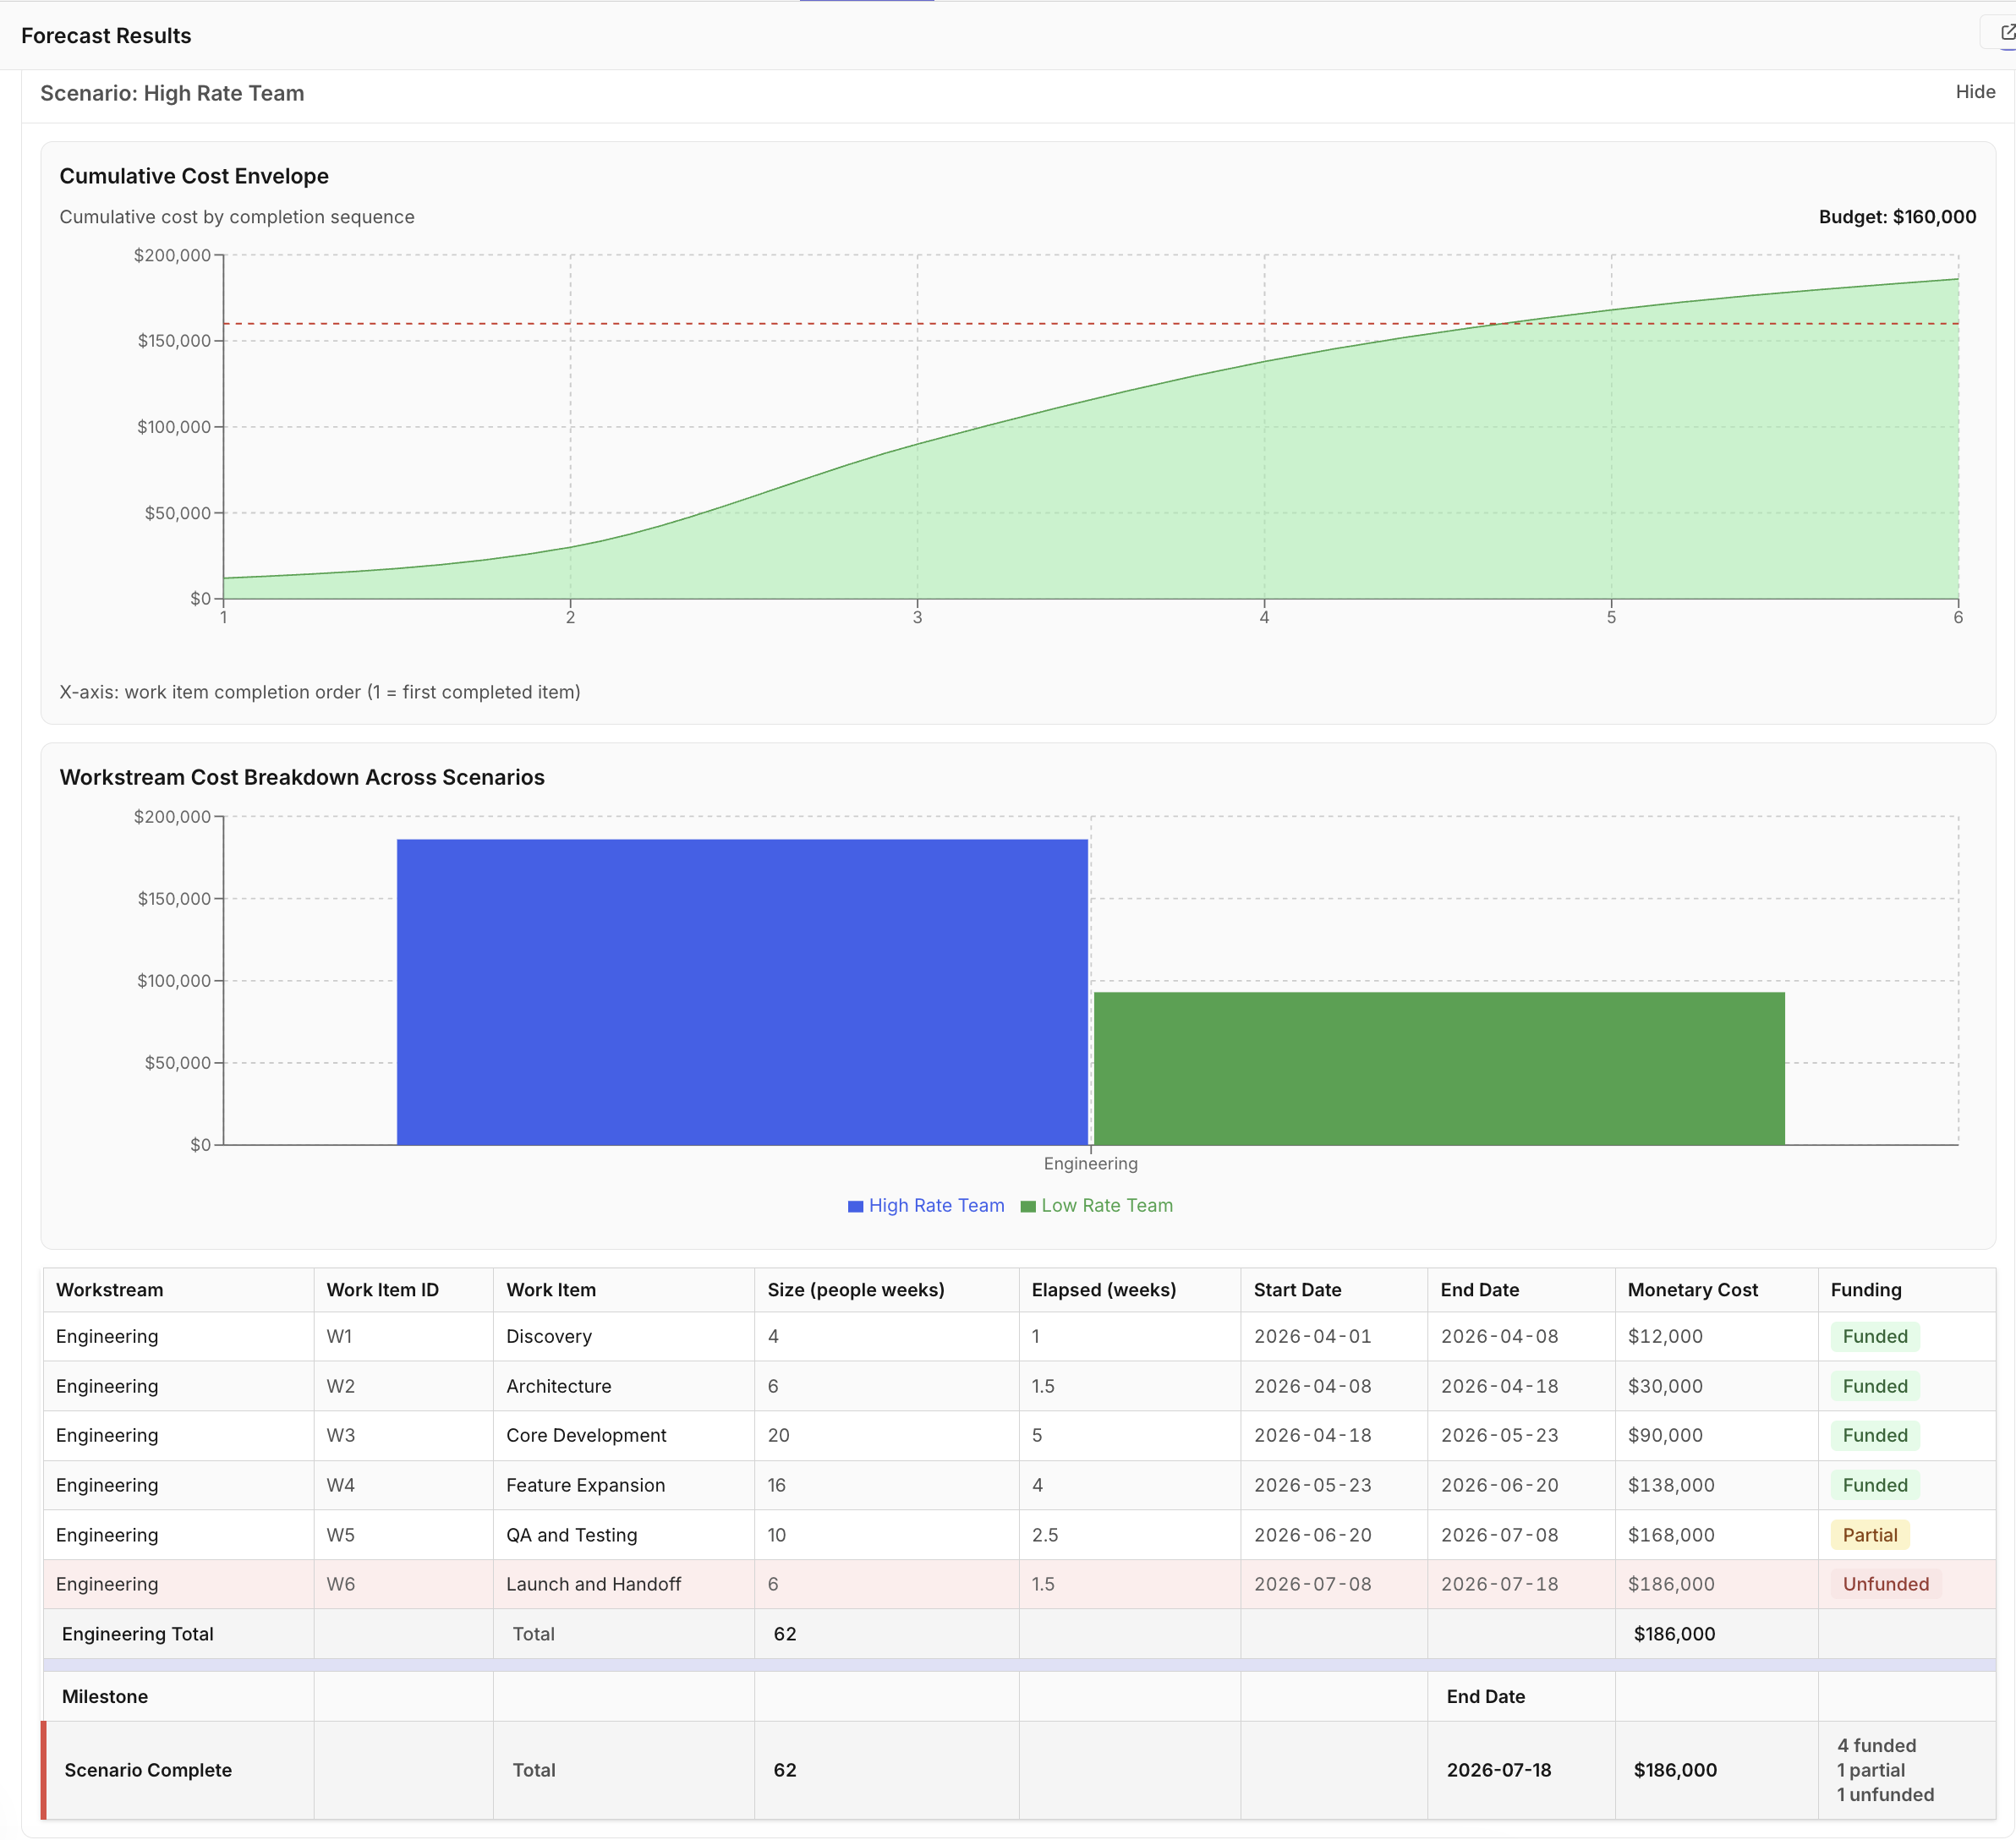
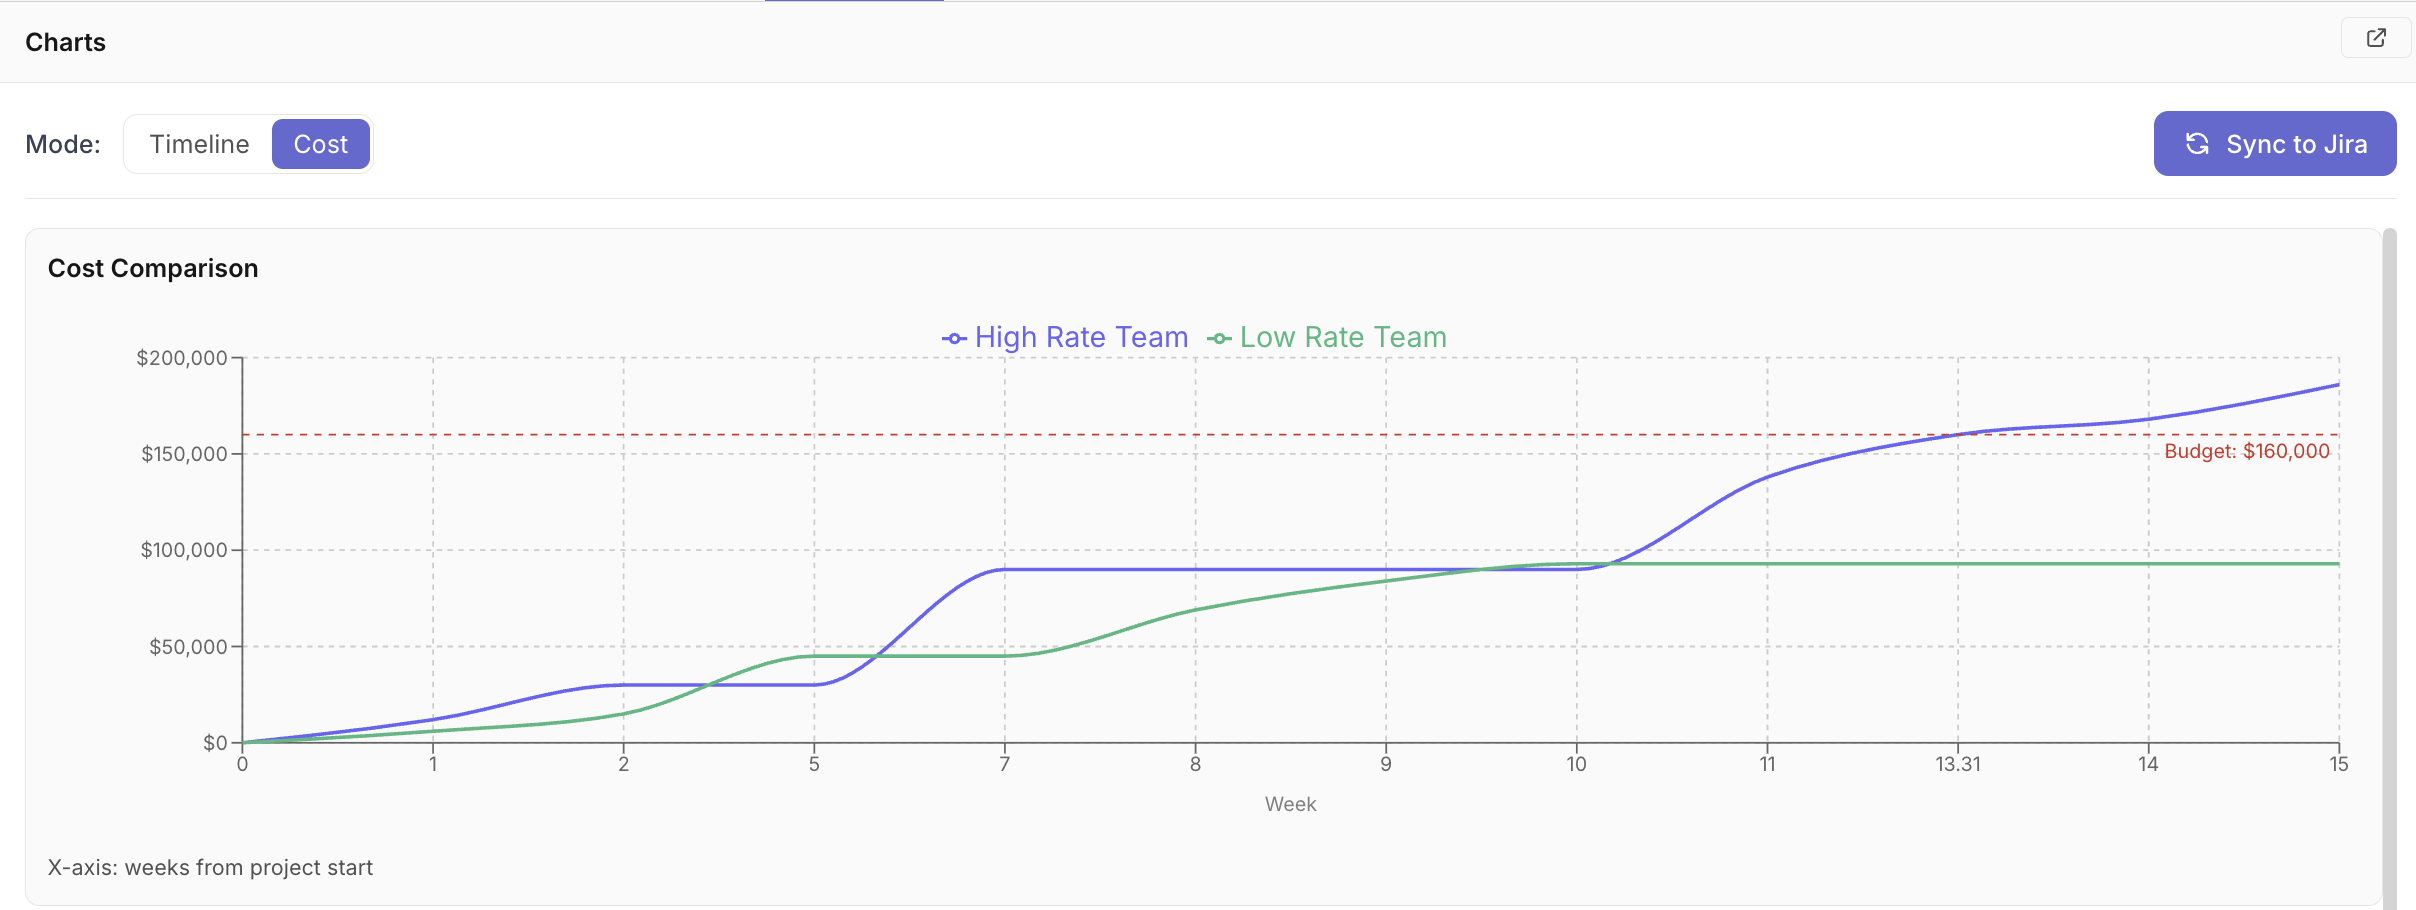
Cost Charts
When costs are configured, the Results panel includes cost charts that visualise cumulative spend over time for each scenario. These charts help you:
- See how quickly the budget is consumed
- Compare cost trajectories between scenarios (e.g. larger team vs. smaller team)
- Identify which scenario delivers the most scope per dollar
When multiple scenarios are configured, an overlay chart plots all cost curves on the same axes so you can directly compare trajectories.
AI Chat Commands
You can configure costs through the AI chat without editing YAML directly. Common commands:
| What to say | Effect |
|---|---|
Set the default unit cost to $1,500 per week | Sets default_unit_cost on the project |
Set Engineering unit cost to $2,000 per week | Sets unit_cost on the Engineering workstream |
Set the budget to $200,000 | Sets budget on the project |
Set the currency to GBP | Sets currency on the project |
What is the total cost of the Baseline scenario? | AI reports the calculated cost |
Tips
- Set
default_unit_costfirst, then override individual workstreams that differ. This is less verbose than settingunit_coston every workstream. - Use consistent units: if capacity is in people weeks,
unit_costshould be cost per person per week. - Compare budget sensitivity: duplicate a scenario, reduce its budget, and see which items drop out — this shows you the minimum scope you can deliver within a tighter spend envelope.
- Currency is display-only: changing
currencydoesn't convert numbers — it just changes the symbol shown in charts and results.
Related Articles
- Using the AI Project Builder - Build projects through AI chat
- Understanding the Forecast Results - Reading the Results tab
- Visualizing Projects - Chart export options
- Managing Workstreams and Dependencies - Capacity and team structure
Last updated: 2026-03-14