Advanced
Importing from Image
Farline AI can extract a project plan from a screenshot, exported Gantt chart, or any visual project timeline. Upload an image and AI vision will identify workstreams, work items, sizes, and dependencies to create a ready-to-forecast project.
What gets imported
When you import from an image, Farline AI uses AI vision to analyse the visual and creates a new project with:
- Project name: inferred from any visible title or heading
- Scenario:
Baseline Scenario - Workstreams: identified from visual groupings, swimlanes, or color-coded sections
- Work items: extracted from task bars, rows, or labeled elements with inferred sizes
- Dependencies: detected from arrows, lines, or sequential positioning
- Milestones: identified from diamond markers or labeled dates
- Start date: read from the timeline axis or inferred from visible dates
Supported formats
| Format | Extensions |
|---|---|
| PNG | .png |
| JPEG | .jpg, .jpeg |
| WebP | .webp |
.pdf (first page) |
Maximum file size: 10 MB
What works well
Import from Image works best with:
- Gantt charts from tools like MS Project, Smartsheet, Monday.com, or Jira Advanced Roadmaps
- Spreadsheet-based project plans with clear columns (task name, duration, dependencies)
- Screenshots of timeline views with visible task bars and dates
- Hand-drawn project timelines with legible text
Example: Before and after
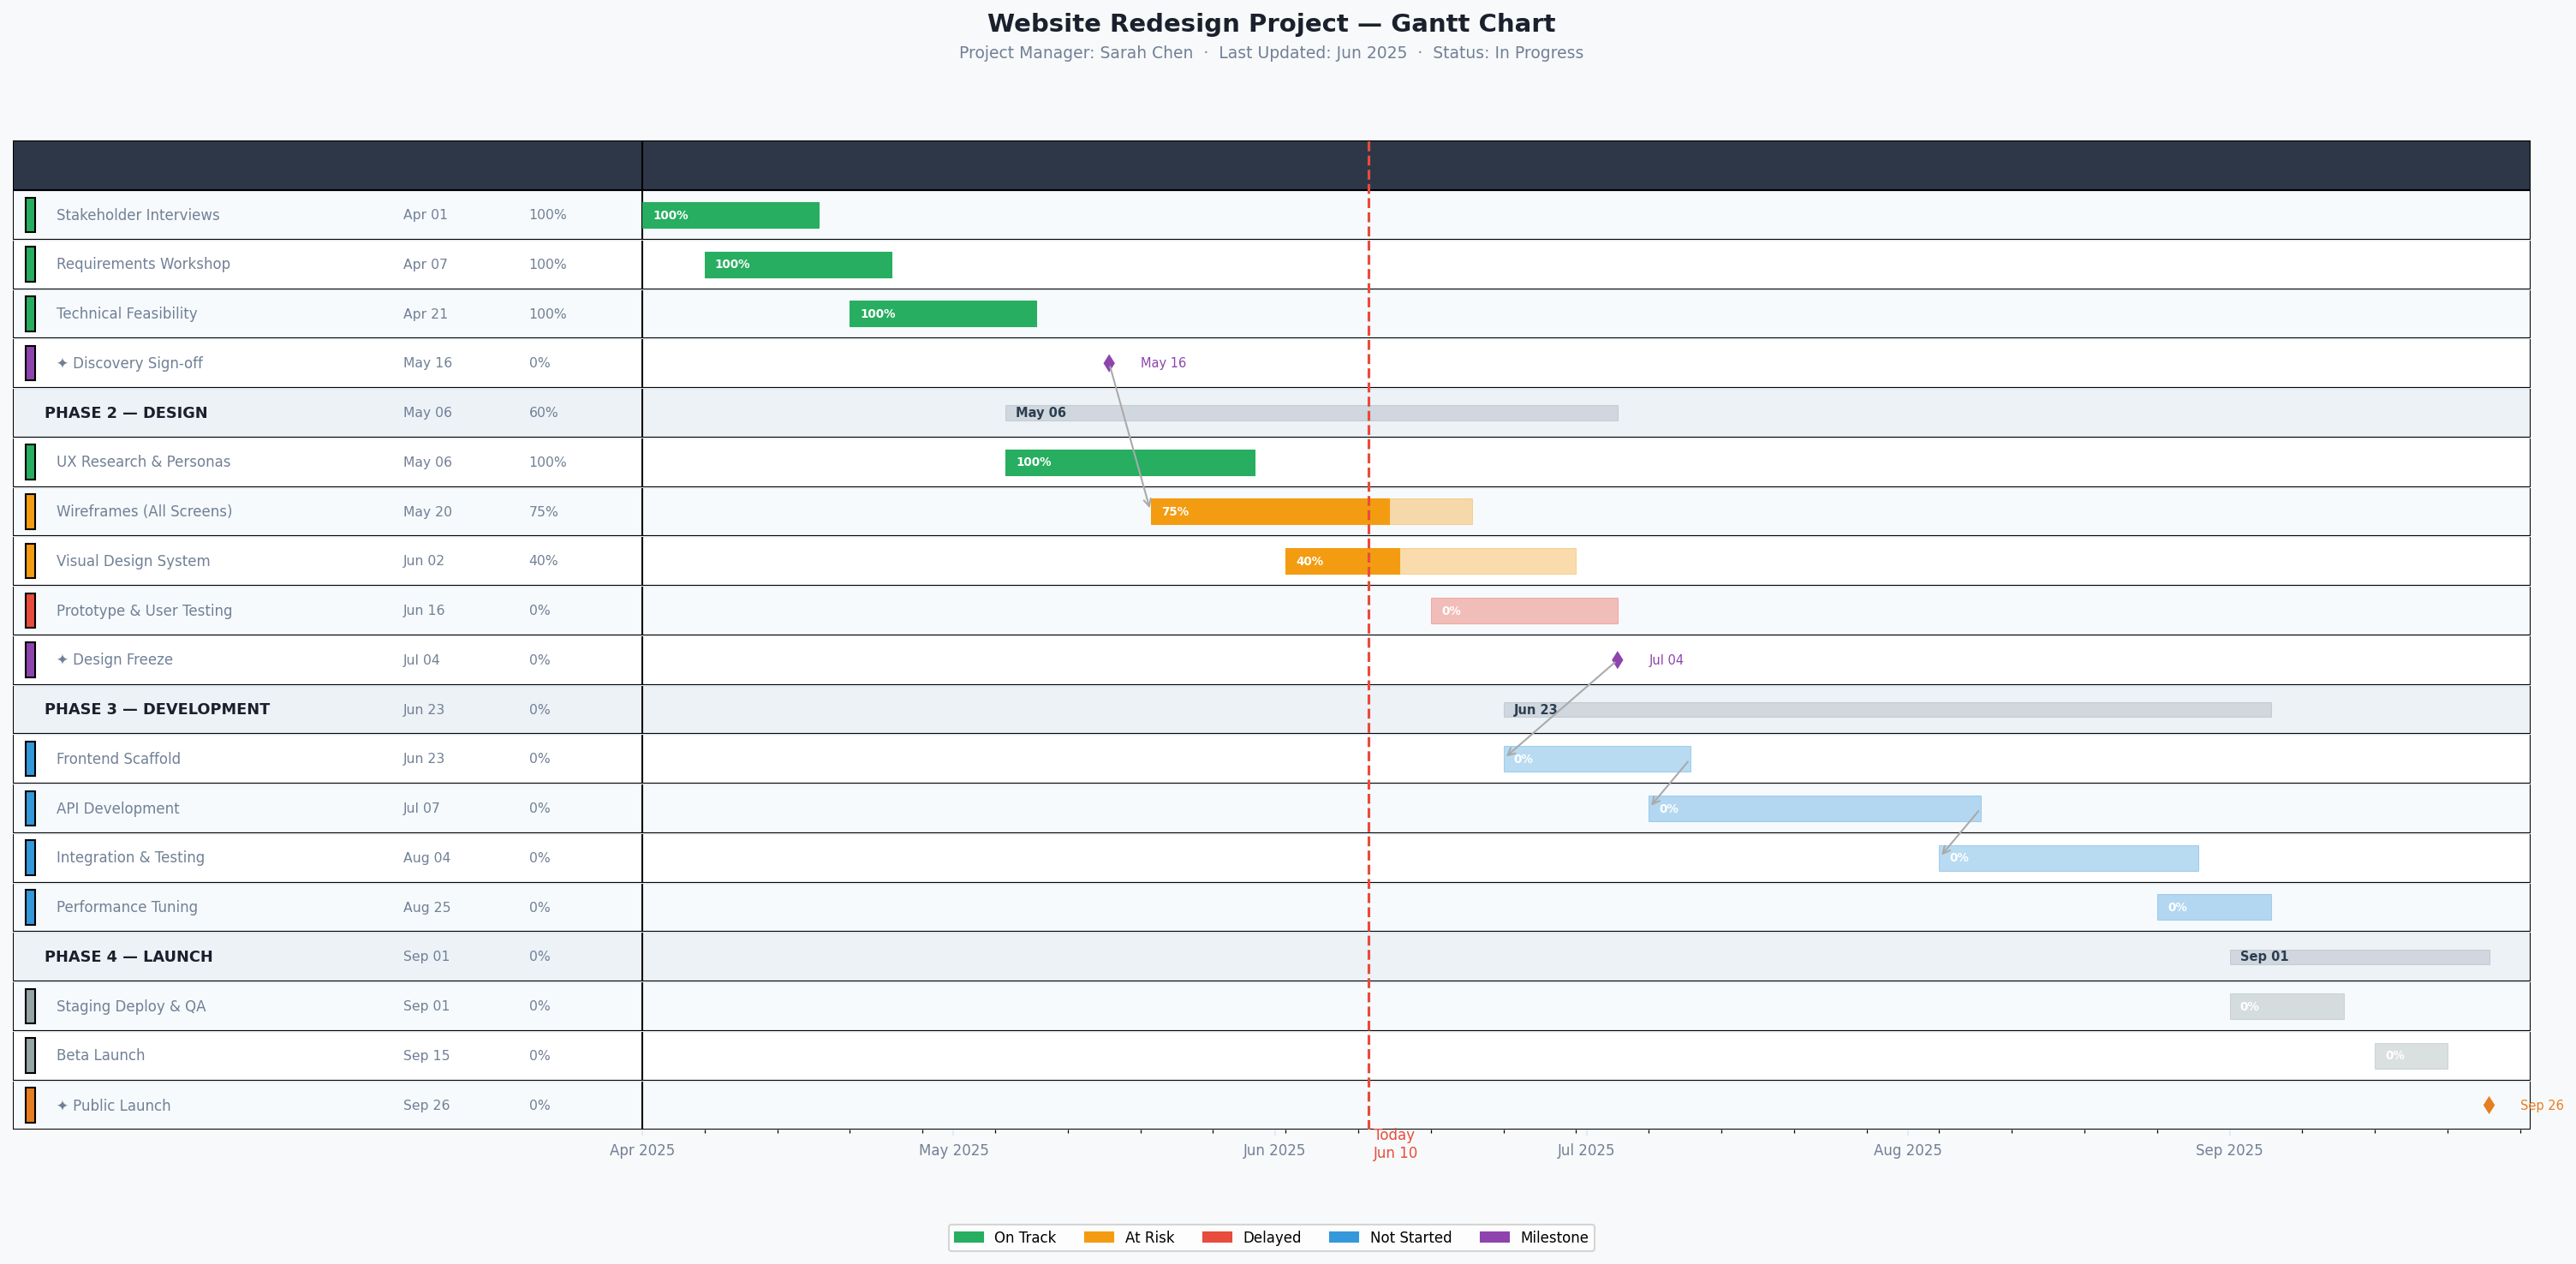
Source image
Upload a Gantt chart or project timeline screenshot like this:
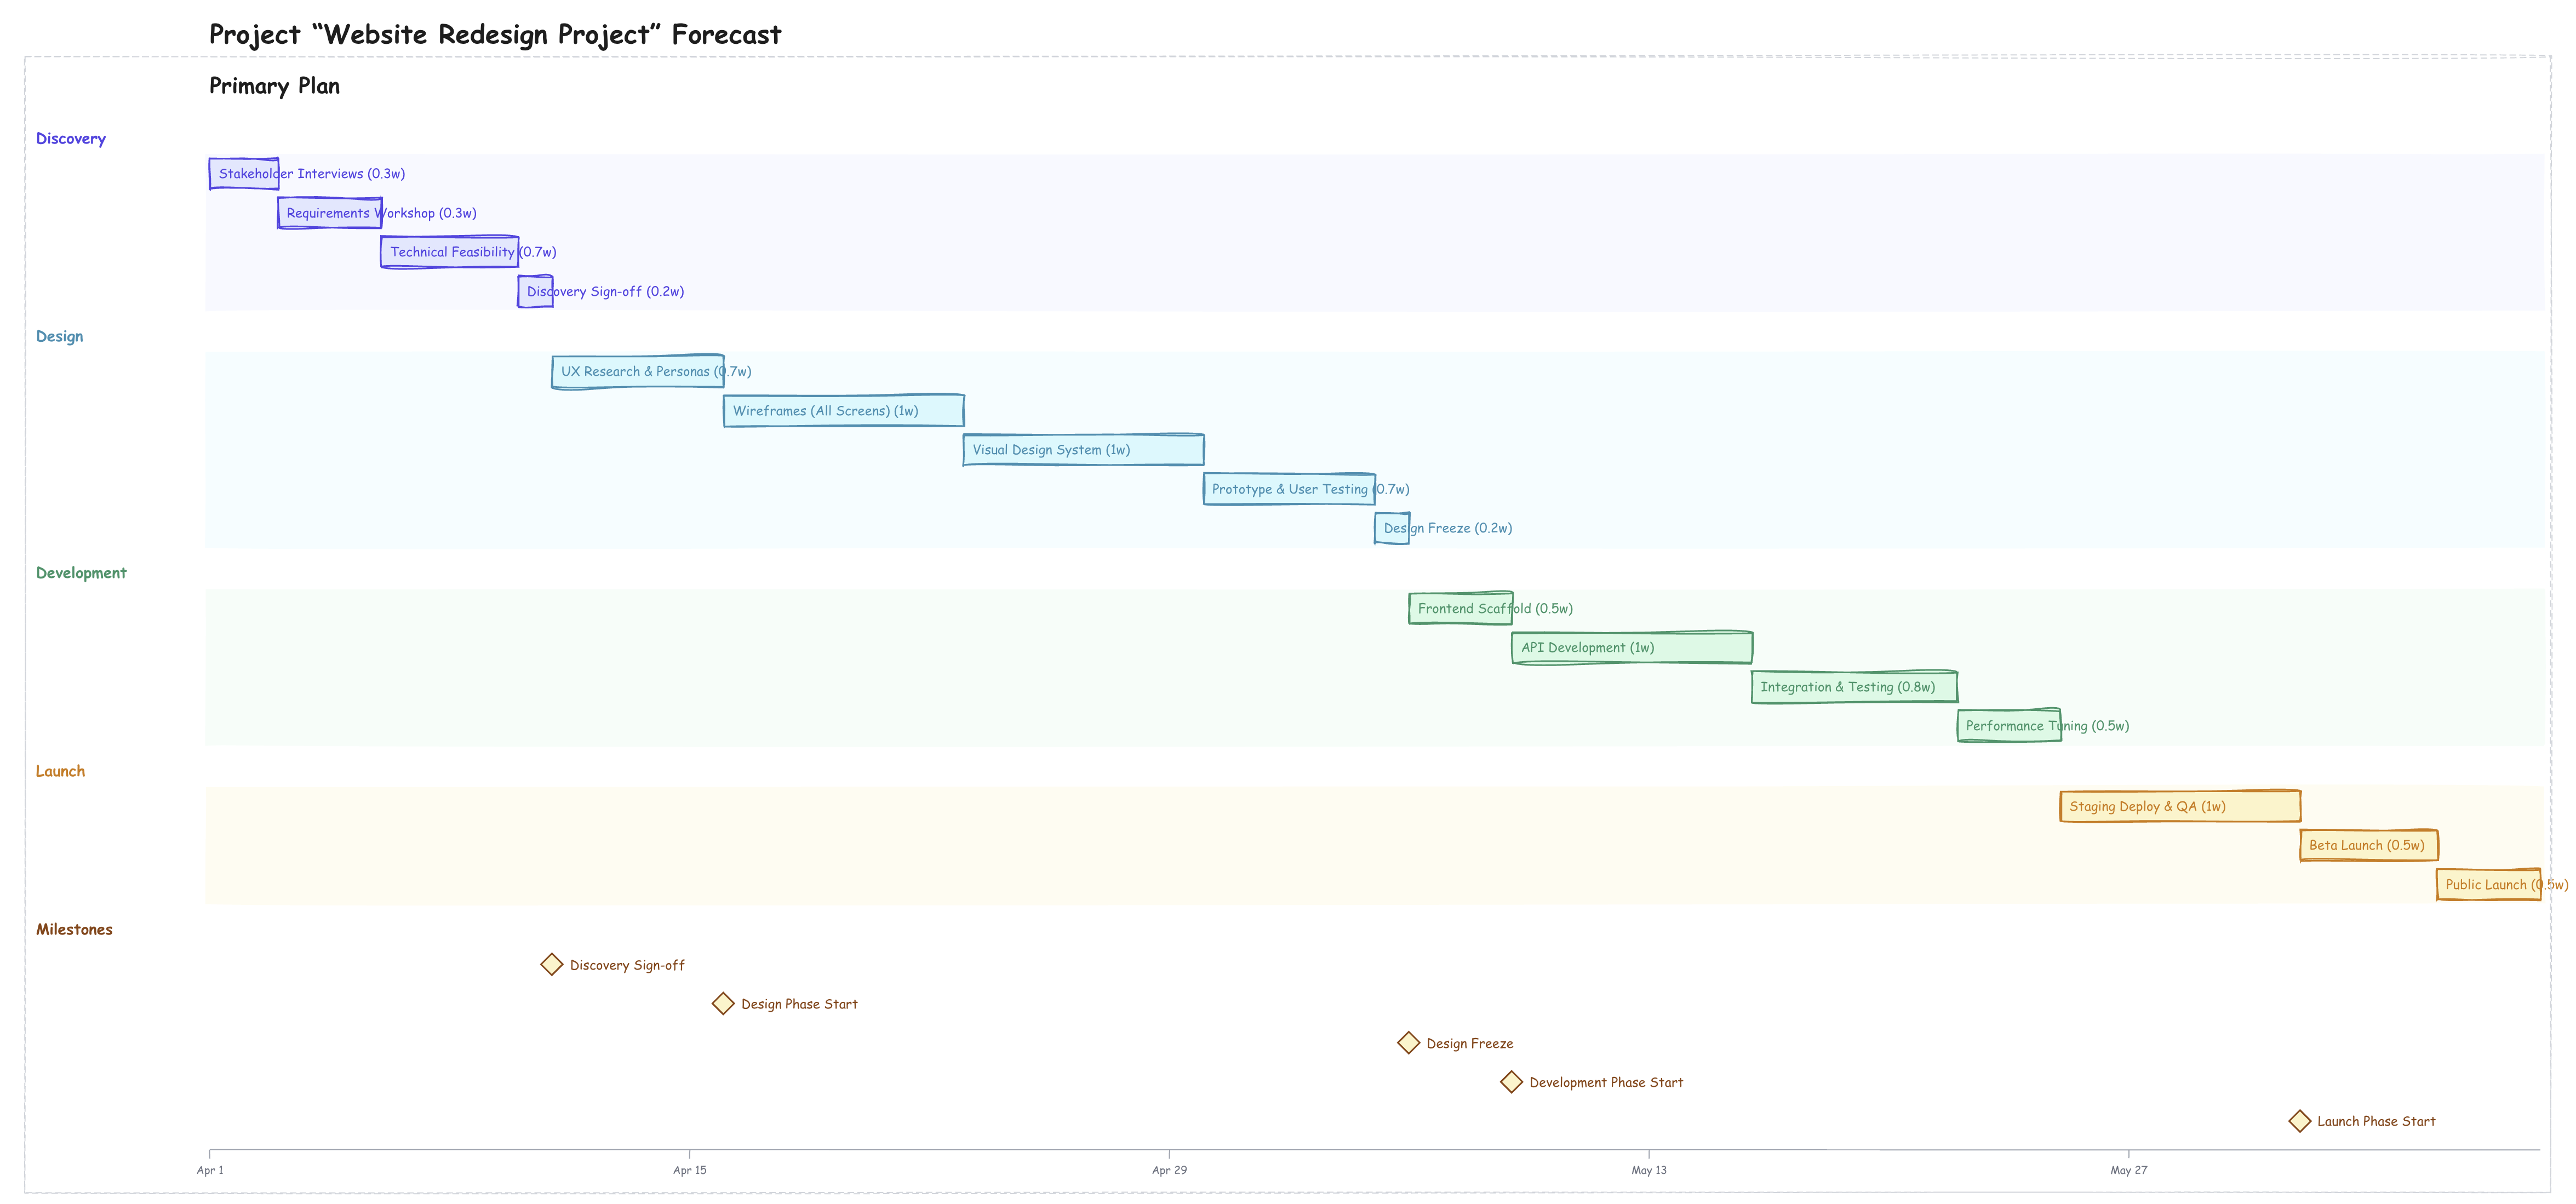
Result in Farline AI
After import, Farline AI generates the project definition and displays the forecast as an Excalidraw chart:
How to import (step-by-step)
From the chat + menu
- Open the Farline AI app.
- Click the + button to the left of the chat input.
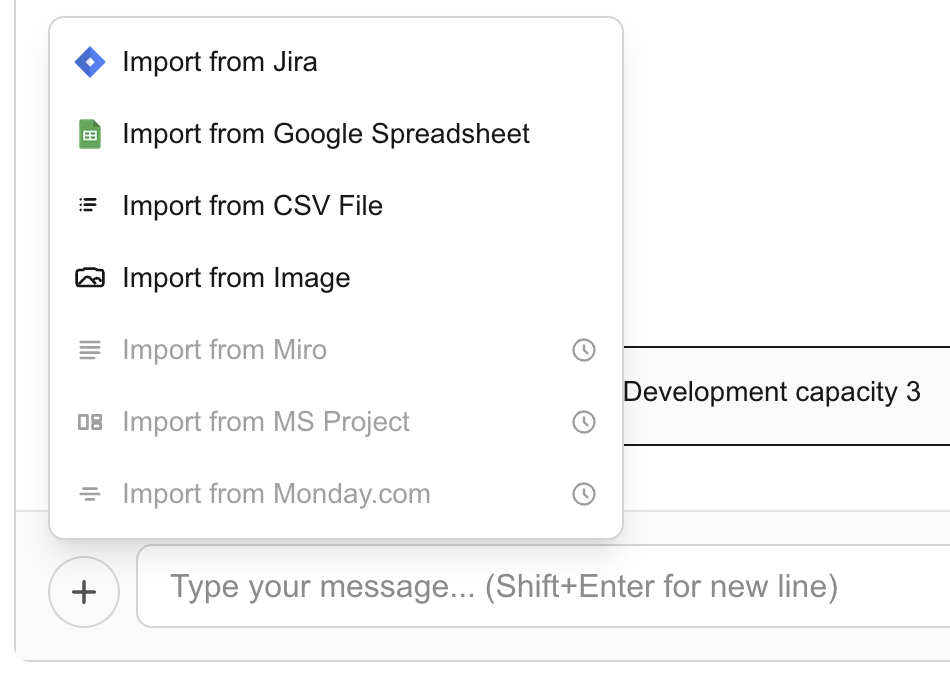
- Select Import from Image.
- The image import dialog opens. Either:
- Drag and drop your image onto the upload zone, or
- Click Browse Files to select from your computer
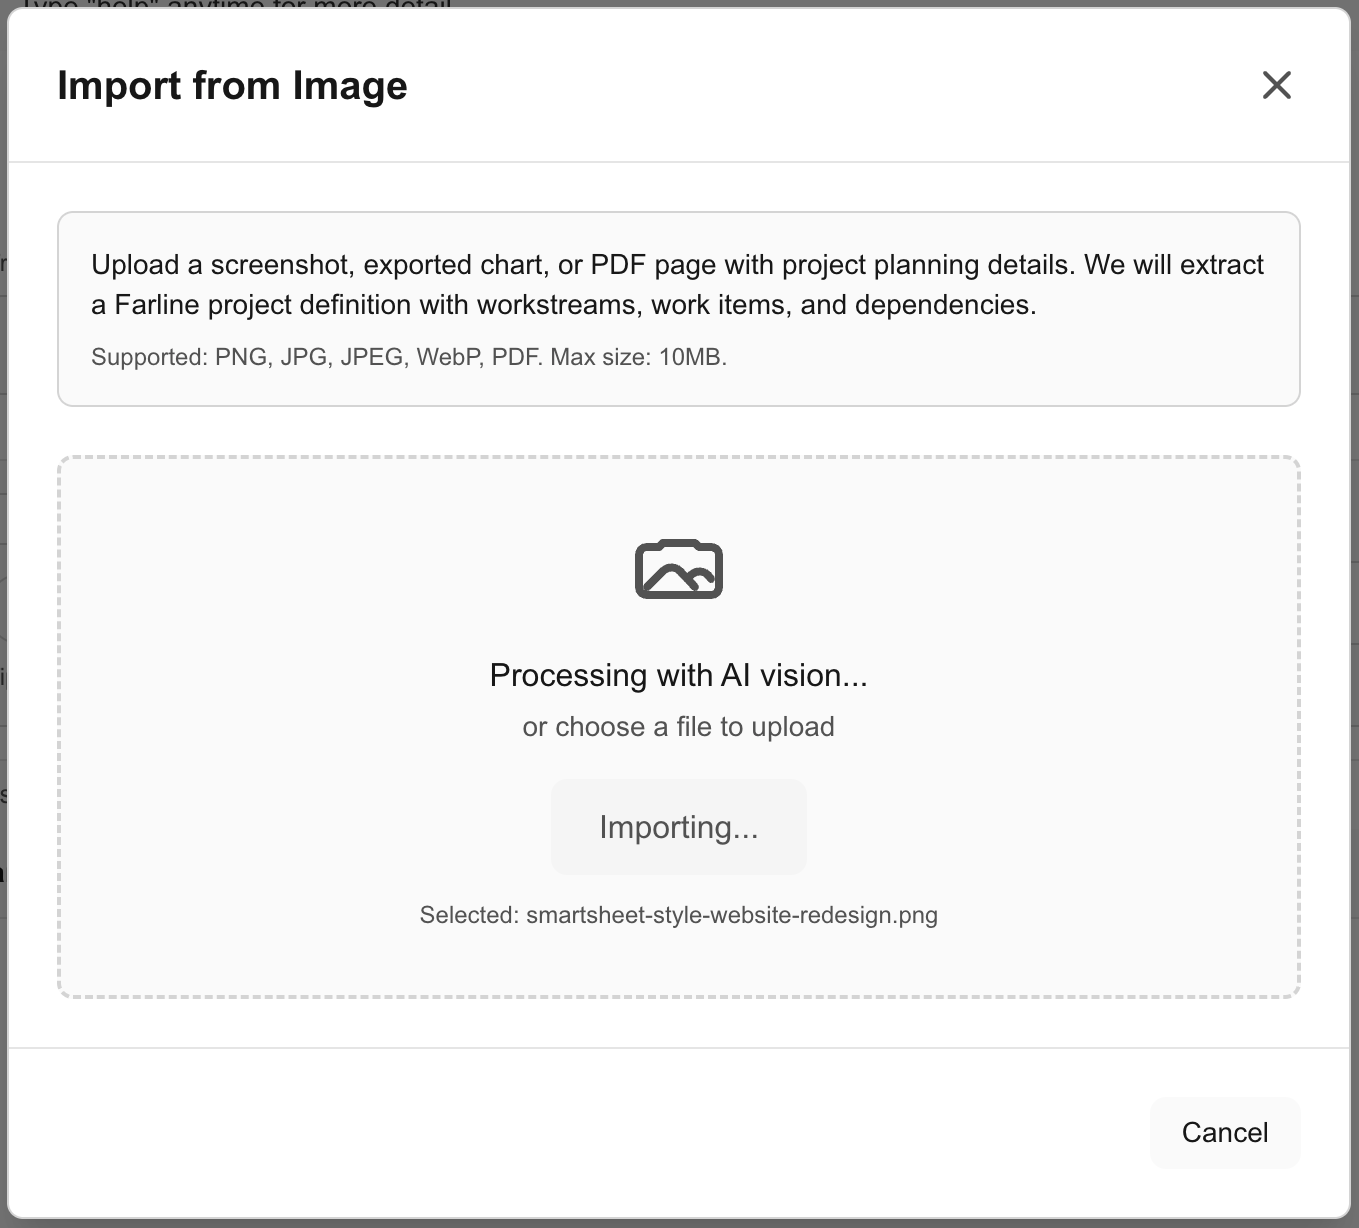
- Farline AI analyses the image with AI vision. This typically takes 10-20 seconds.
- On success, the extracted project definition loads into the editor and the forecast chart appears.
From the top menu
You can also access Import from Image via Menu > Import > From Image (coming in a future update).
Tips for best results
- Use high-resolution images - Larger, clearer images produce better extraction results
- Include visible dates - Charts with a date axis give the AI better context for scheduling
- Show task names clearly - Ensure task/work item labels are legible and not cut off
- Include dependency arrows - Visual dependency lines help the AI map relationships correctly
- Crop to the chart area - Remove toolbars, sidebars, and other UI chrome for cleaner extraction
After importing
- Review the definition - Open the Advanced Editor tab to check the extracted workstreams, work items, and dependencies
- Adjust sizes - AI-estimated sizes may need refinement based on your team's estimation approach
- Verify dependencies - Check that dependency chains match the source chart
- Run a forecast - The forecast generates automatically once the definition is valid
- Compare to source - Use the Excalidraw chart to visually compare against your original image
Troubleshooting
Import produces few or no work items
- The image may be too small or low resolution. Try a higher-quality export.
- Complex charts with overlapping elements can confuse extraction. Crop to a cleaner section.
- Charts with very small text may not be readable. Zoom in and re-screenshot.
Dependencies are missing or wrong
- If the source chart doesn't show explicit dependency arrows, the AI may not infer them. Add dependencies manually in the editor.
- Sequential positioning (task A ends where task B starts) is sometimes interpreted as a dependency, sometimes not.
Import fails with an error
- Check that your file is under 10 MB.
- Ensure the file is a supported format (PNG, JPEG, WebP, or PDF).
- PDFs are processed first-page only. If your chart spans multiple pages, screenshot the relevant page instead.
Extracted dates look wrong
- The AI reads dates from the chart's timeline axis. If dates are partially obscured or in an unusual format, they may be misread.
- You can correct start dates in the Advanced Editor after import.
Related articles
- Visualizing Projects with Charts - Understanding Excalidraw and other chart formats
- 2-Way Sync with Jira - Import and export with Jira
- Using the Advanced Editor - Edit your project definition
Last updated: 2026-03-09